
June 03, 2026 a 11:31 am
MAA: Dividend Analysis - Mid-America Apartment Communities, Inc.
🗣️ Mid-America Apartment Communities, Inc. (MAA) showcases a robust dividend profile with a yield that remains competitive in the real estate sector. The company's long-standing dividend history of 33 years without cuts emphasizes its commitment to rewarding shareholders. However, the high payout ratio, especially when assessed against EPS and free cash flow, requires cautious observation. Investors should weigh the moderate yet consistent dividend growth against these payout sustainability concerns.
📊 Overview
| Metric | Value |
|---|---|
| Sector | Real Estate |
| Dividend yield | 4.73 % |
| Current dividend per share | 6.09 USD |
| Dividend history | 33 years |
| Last cut or suspension | None |
📈 Dividend History
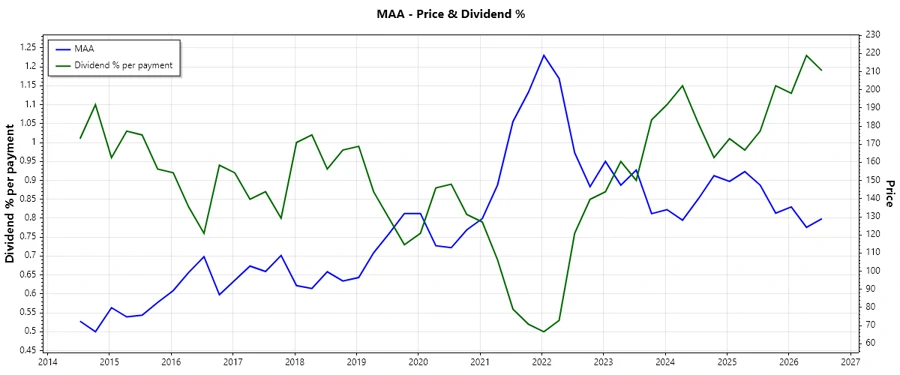
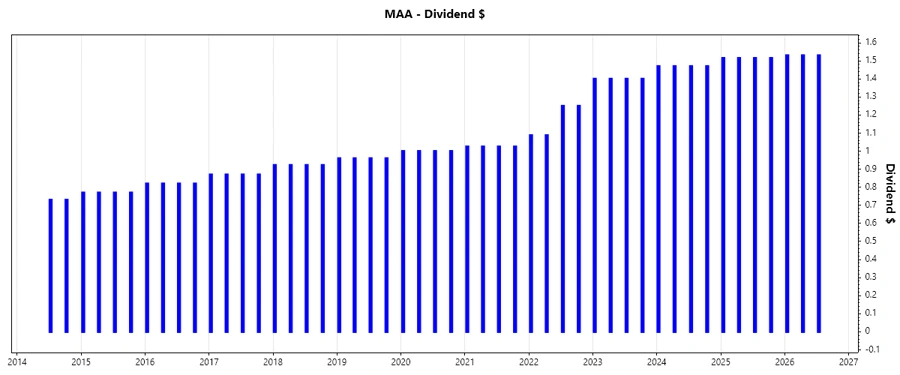
The dividend history of Mid-America Apartment Communities highlights a commendable track record of stability, reinforcing the company's reliability as a dividend payer. This stability is an essential factor for income-focused investors looking to depend on consistent dividend payouts.
| Year | Dividend per share (USD) |
|---|---|
| 2026 | 4.59 |
| 2025 | 6.06 |
| 2024 | 5.88 |
| 2023 | 5.60 |
| 2022 | 4.68 |
📉 Dividend Growth
Analyzing dividend growth aids in understanding future income potential. MAA's dividend growth suggests resilience and potential for future increases, even amid market volatility.
| Time | Growth |
|---|---|
| 3 years | 9.03 % |
| 5 years | 8.66 % |
The average dividend growth is 8.66 % over 5 years. This shows moderate but steady dividend growth.
✅ Payout Ratio
The payout ratio analysis offers insights into dividend sustainability. High ratios indicate potential risk in maintaining dividends without additional earnings improvement or market conditions.
| Key figure | Ratio |
|---|---|
| EPS-based | 182.10 % |
| Free cash flow-based | 116.24 % |
The EPS-based payout ratio of 182.10 % and the FCF-based ratio of 116.24 % reflect a high dividend payout, suggesting caution due to limitations in earnings coverage.
✅ Cashflow & Capital Efficiency
Effective cash flow management is crucial for sustaining operations and supporting dividends without over-leveraging. Capital efficiency metrics reflect strategic investment and operational efficacy.
| Metric | 2023 | 2024 | 2025 |
|---|---|---|---|
| Free Cash Flow Yield | 5.08 % | 4.30 % | 4.42 % |
| Earnings Yield | 3.53 % | 2.92 % | 2.75 % |
| CAPEX to Operating Cash Flow | 30.01 % | 29.35 % | 33.41 % |
| Stock-based Compensation to Revenue | 0.73 % | 0.72 % | 0.76 % |
| Free Cash Flow / Operating Cash Flow Ratio | 70 % | 71 % | 67 % |
Strong capital efficiency and cash flow ratios, supported by positive operational cash flows, indicate stability and prudent management, essential for fostering investor confidence.
⚠️ Balance Sheet & Leverage Analysis
Balance sheet strength is integral to financial stability, assessing leverage ratios reveals dependency on debt, impacting risk profiles and creditworthiness.
| Metric | 2023 | 2024 | 2025 |
|---|---|---|---|
| Debt-to-Equity | 0.75 | 0.84 | 0.95 |
| Debt-to-Assets | 39.77 % | 42.39 % | 45.14 % |
| Debt-to-Capital | 42.76 % | 45.64 % | 48.75 % |
| Net Debt to EBITDA | 3.52 | 3.81 | 4.05 |
| Current Ratio | 0.052 | 0.075 | 0.165 |
| Quick Ratio | 0.052 | 0.075 | 0.165 |
| Financial Leverage | 1.88 | 1.98 | 2.11 |
Increasing leverage and debt metrics underscore the necessity for strategic debt management to maintain financial stability and long-term operational efficiency.
📈 Fundamental Strength & Profitability
Profitability ratios provide insight into earnings efficacy, whereas R&D investment comparisons suggest commitment to innovation and potential for long-term growth.
| Metric | 2023 | 2024 | 2025 |
|---|---|---|---|
| Return on Equity | 9.04 % | 8.84 % | 7.86 % |
| Return on Assets | 4.81 % | 4.47 % | 3.73 % |
| Margin - Net | 25.73 % | 24.08 % | 20.23 % |
| Margin - EBIT | 33.52 % | 32.56 % | 31.50 % |
| Margin - EBITDA | 59.85 % | 59.32 % | 59.69 % |
| Margin - Gross | 34.79 % | 32.55 % | 31.83 % |
Sustained profitability with consistent margins highlights operational strength, yet a slight decline in ROE suggests potential efficiency improvements.
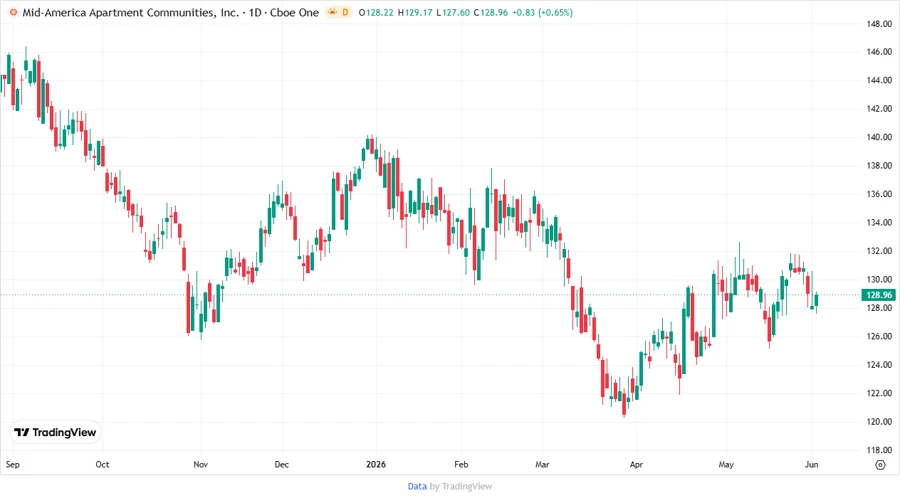
📉 Price Development
Dividend Scoring System
| Criterion | Score | Bar |
|---|---|---|
| Dividend yield | 4 | |
| Dividend Stability | 5 | |
| Dividend growth | 4 | |
| Payout ratio | 2 | |
| Financial stability | 3 | |
| Dividend continuity | 5 | |
| Cashflow Coverage | 3 | |
| Balance Sheet Quality | 3 |
Total Score: 29/40
Rating
Overall, Mid-America Apartment Communities holds a strong dividend track record amidst financial metrics that warrant further observation. Continued performance monitoring and strategic financial management will be crucial in validating MAA as an attractive investment within the real estate sector.
Smart Data Insight
Master the Perfect Entry & Exit for this Stock
Don't leave your profits to chance. Historically, this stock follows specific seasonal patterns that institutional traders use to maximize returns.
- ✅ Identify the "Golden Buying Window"
- ✅ Avoid high-risk correction cycles
- ✅ Backtested data from the last 20+ years