
April 18, 2026 a 12:46 pm

MAA: Dividend Analysis - Mid-America Apartment Communities, Inc.
The analysis presents Mid-America Apartment Communities, Inc. as a potentially rewarding dividend stock due to its strong historical dividend performance and consistent growth in dividends. The company's robust sector presence in residential real estate further supports its attractiveness. However, the high EPS payout ratio may raise concerns about sustainability. Careful assessment of their strong cash flow and strategic debt management is essential for future expectations.
📊 Overview
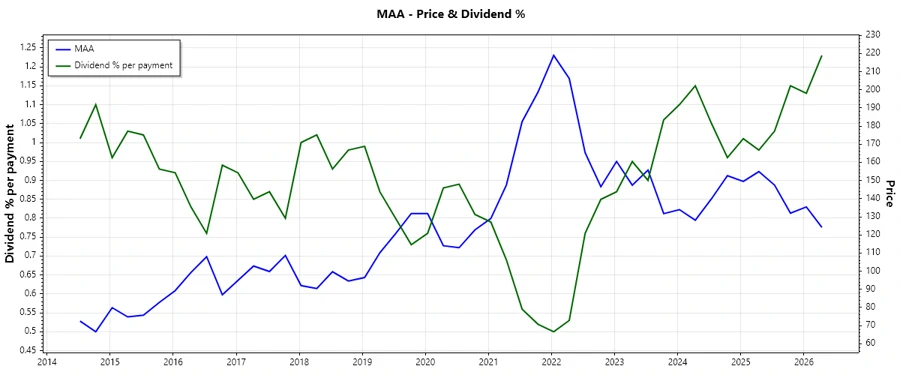
Mid-America Apartment Communities, Inc. operates in the residential real estate sector, offering a competitive dividend yield of 4.90%. With a current dividend per share of 6.09 USD and a lengthy dividend history of 33 years, it is evident that the company has been a consistent performer in terms of shareholder returns. Notably, the company has no recent history of dividend cuts or suspensions, highlighting its stable financial performance.
| Metric | Detail |
|---|---|
| Sector | Residential Real Estate |
| Dividend Yield | 4.90% |
| Current Dividend Per Share | 6.09 USD |
| Dividend History | 33 years |
| Last Cut or Suspension | None |
🗣️ Dividend History
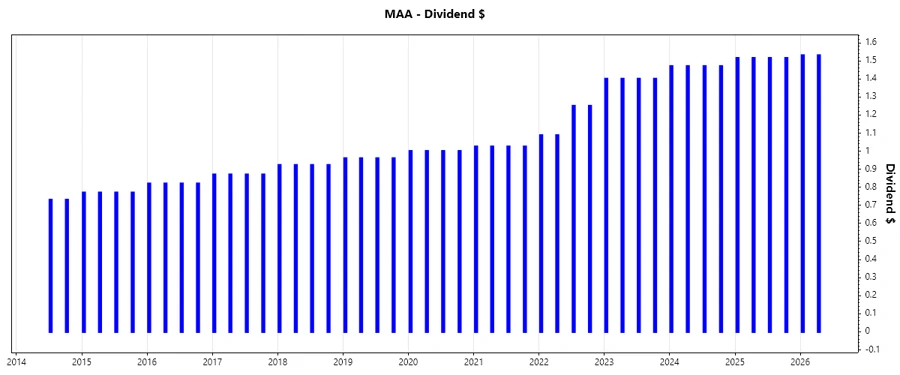
Observing the dividend history is crucial as it provides insight into a company's commitment to returning value to shareholders. A consistent or growing dividend over the years is often viewed as a sign of financial health and management's confidence in cash flow stability.
| Year | Dividend Per Share (USD) |
|---|---|
| 2026 | 3.06 |
| 2025 | 6.06 |
| 2024 | 5.88 |
| 2023 | 5.60 |
| 2022 | 4.68 |
📈 Dividend Growth
Dividend growth is a critical indicator of a company's financial performance and shareholder value increase. The 3-year and 5-year growth percentages of 9.03% and 8.66%, respectively, suggest a healthy pace of growth, underscoring management's commitment to increasing shareholder returns over time.
| Time | Growth |
|---|---|
| 3 Years | 9.03% |
| 5 Years | 8.66% |
The average dividend growth is 8.66% over 5 years. This indicates moderate but steady dividend growth, suggesting a strong likelihood of increased future dividends if economic conditions remain stable.
✅ Payout Ratio
The payout ratio is a key indicator of dividend sustainability. With an EPS-based payout ratio of 159.48% and a free cash flow-based payout ratio of 99.20%, the company distributes a significant proportion of its earnings as dividends. Such levels could imply a potential risk to dividend sustainability if earnings were to decline.
| Key Figure | Ratio |
|---|---|
| EPS-based | 159.48% |
| Free Cash Flow-based | 99.20% |
The high EPS payout ratio signifies that the company is paying more out in dividends than it earns, which may not be sustainable in the long term unless earnings increase significantly. Nonetheless, the free cash flow ratio is close to 100%, indicating a reliance on cash flow to sustain dividends.
💸 Cashflow & Capital Efficiency
Analyzing cash flow metrics is essential, as it highlights the company's ability to generate liquidity and cover its liabilities and obligations. Additionally, capital efficiency metrics evaluate how effectively a company uses its capital to generate returns.
| Metric | 2023 | 2024 | 2025 |
|---|---|---|---|
| Free Cash Flow Yield | 5.08% | 4.30% | 4.42% |
| Earnings Yield | 3.53% | 2.92% | 2.75% |
| CAPEX to Operating Cash Flow | 30.01% | 29.35% | 33.41% |
| Stock-based Compensation to Revenue | 0.73% | 0.72% | 0.76% |
| Free Cash Flow / Operating Cash Flow Ratio | 70% | 71% | 67% |
The company's ability to generate substantial free cash flow highlights strong operational performance, though the high CAPEX to cash flow ratio suggests considerable reinvestment, which requires monitoring for impacts on liquidity.
⚠️ Balance Sheet & Leverage Analysis
The balance sheet analysis, coupled with leverage metrics, offers insight into the company's financial stability and its ability to handle debt responsibly. This is crucial for long-term sustainability and financial health.
| Metric | 2023 | 2024 | 2025 |
|---|---|---|---|
| Debt-to-Equity | 0.75 | 0.84 | 0.95 |
| Debt-to-Assets | 0.40 | 0.42 | 0.45 |
| Debt-to-Capital | 0.43 | 0.46 | 0.49 |
| Net Debt to EBITDA | 3.52 | 3.82 | 4.05 |
| Current Ratio | 0.05 | 0.08 | 0.16 |
| Quick Ratio | 0.05 | 0.08 | 0.16 |
| Financial Leverage | 1.88 | 1.98 | 2.11 |
While the debt metrics are manageable, especially with strong interest coverage, the increasing leverage ratios may require close monitoring to ensure continued financial health without jeopardizing credit ratings.
🔍 Fundamental Strength & Profitability
Strong fundamentals and profitability indicators are pivotal for ensuring robust business performance and the capacity to pay dividends regularly. These metrics provide a deeper understanding of operational efficiency and management effectiveness.
| Metric | 2023 | 2024 | 2025 |
|---|---|---|---|
| Return on Equity | 9.04% | 8.84% | 7.86% |
| Return on Assets | 4.81% | 4.47% | 3.73% |
| Margins: Net | 25.73% | 24.08% | 20.23% |
| Margins: EBIT | 33.52% | 32.56% | 31.50% |
| Margins: EBITDA | 59.85% | 59.32% | 59.69% |
| Margins: Gross | 34.79% | 32.55% | 31.83% |
| R&D to Revenue | 0% | 0% | 0% |
The robust return on equity and assets highlights efficient use of resources, though a focus on improving net margins and leveraging margins through operational efficiency could optimize shareholder value further.
💹 Price Development
🔢 Dividend Scoring System
| Category | Score (1-5) | Score Bar |
|---|---|---|
| Dividend Yield | 4 | |
| Dividend Stability | 5 | |
| Dividend Growth | 4 | |
| Payout Ratio | 3 | |
| Financial Stability | 3 | |
| Dividend Continuity | 5 | |
| Cashflow Coverage | 4 | |
| Balance Sheet Quality | 3 |
Total Score: 31/40
🎯 Rating
Overall, Mid-America Apartment Communities, Inc. offers a robust dividend profile, marked by stability and growth consistency. The high payout ratios necessitate careful monitoring, though strong cash flows and sustained dividend growth provide a positive outlook. The company remains an attractive option for dividend-focused investors, albeit with considerations for potential long-term risks associated with high payout levels.
Smart Data Insight
Master the Perfect Entry & Exit for this Stock
Don't leave your profits to chance. Historically, this stock follows specific seasonal patterns that institutional traders use to maximize returns.
- ✅ Identify the "Golden Buying Window"
- ✅ Avoid high-risk correction cycles
- ✅ Backtested data from the last 20+ years