November 12, 2025 a 03:31 pm

MAA: Dividend Analysis - Mid-America Apartment Communities, Inc.
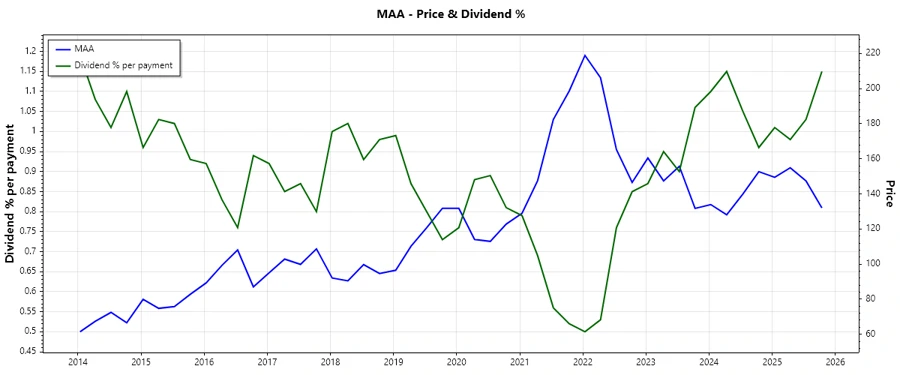
Mid-America Apartment Communities, Inc. exhibits a robust dividend profile, marked by a 32-year history of consistent payouts. Despite a high EPS-based payout ratio, its dividend yield of 4.59% signifies an attractive income opportunity for investors. Continuous dividend growth and strong sector positioning sustain MAA's appeal amidst volatile market conditions.
📊 Overview
Investors eyeing MAA can expect a reliable income stream from its dividends. The Real Estate sector, known for its capital-intensive nature, aligns with MAA's strategic dividend approach, offering a yield of 4.59%. Here's a snapshot of some key metrics:
| Sector | Dividend Yield (%) | Current Dividend Per Share (USD) | Dividend History (Years) | Last Cut/Suspension |
|---|---|---|---|---|
| Real Estate | 4.59% | 5.91 | 32 | None |
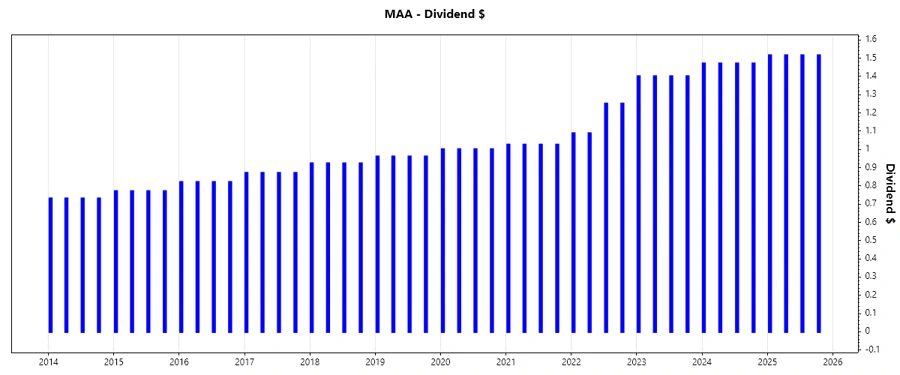
🗣️ Dividend History
Maintaining a continuous dividend distribution is a testament to fiscal prudence and stability. MAA's ability to uphold dividends through economic cycles underscores its resilience. This historical consistency provides assurance to prospective stakeholders.
| Year | Dividend Per Share (USD) |
|---|---|
| 2025 | 6.060 |
| 2024 | 5.88 |
| 2023 | 5.6 |
| 2022 | 4.675 |
| 2021 | 4.1 |
📈 Dividend Growth
Consistent dividend growth is pivotal for long-term income maximization and capital appreciation. Although modest, the growth trajectory reflects management's commitment to enhancing shareholder value through sustainable practices.
| Time | Growth |
|---|---|
| 3 years | 12.77% |
| 5 years | 8.90% |
The average dividend growth is 8.90% over 5 years. This shows moderate but steady dividend growth, signaling confidence in future revenue capabilities.
⚖️ Payout Ratio
Payout ratios indicate how much of a company's earnings are paid out as dividends. A high EPS-based payout ratio of 124.42% may raise sustainability concerns, yet it might be supported by other metrics such as FCF payout ratio.
| Key Figure | Ratio |
|---|---|
| EPS-based | 124.42% |
| Free cash flow-based | 91.51% |
The EPS-based payout of 124.42% is higher than ideal, posing potential risks. However, the FCF-based payout remains under 100%, providing a buffer for dividend maintenance.
💼 Cashflow & Capital Efficiency
Efficient cash flow management and capital utilization are vital for meeting dividend obligations and reinvestment needs. Evaluating these aspects can reveal a company's operational health and future capabilities.
| 2024 | 2023 | 2022 | |
|---|---|---|---|
| Free Cash Flow Yield | 4.30% | 5.08% | 4.21% |
| Earnings Yield | 2.92% | 3.53% | 3.52% |
| CAPEX to Operating Cash Flow | 29.35% | 30.01% | 27.98% |
| Stock-based Compensation to Revenue | 0.72% | 0.73% | 0.93% |
| Free Cash Flow / Operating Cash Flow Ratio | 70.65% | 69.99% | 72.01% |
Strong free cash flow yields with moderate CAPEX spending signal effective capital allocation, crucial for sustaining dividends and future growth.
🏦 Balance Sheet & Leverage Analysis
A comprehensive assessment of leverage and liquidity stresses a company's ability to manage debt and operational expenditures, preserving its financial integrity.
| 2024 | 2023 | 2022 | |
|---|---|---|---|
| Debt-to-Equity | 83.95% | 74.72% | 73.74% |
| Debt-to-Assets | 42.39% | 39.77% | 39.53% |
| Debt-to-Capital | 45.64% | 42.76% | 42.44% |
| Net Debt to EBITDA | 3.81 | 3.52 | 3.27 |
| Current Ratio | 0.075 | 0.052 | 0.109 |
| Quick Ratio | 0.075 | 0.052 | 0.109 |
| Financial Leverage | 1.98 | 1.88 | 1.87 |
Stable debt metrics and improving leverage ratios suggest manageable risk levels, but enhanced liquidity would augment financial resilience.
🔎 Fundamental Strength & Profitability
Robust profitability measures are crucial for dividend sustenance and corporate longevity. Analyzing margins and return ratios can offer insights into management efficiency and market positioning.
| 2024 | 2023 | 2022 | |
|---|---|---|---|
| Return on Equity | 8.84% | 9.04% | 10.58% |
| Return on Assets | 4.47% | 4.81% | 5.67% |
| Margins: Net, EBIT, EBITDA, Gross | 24.08%, 32.56%, 59.32%, 32.55% | 25.73%, 33.52%, 59.85%, 34.79% | 31.56%, 39.69%, 66.63%, 34.05% |
| R&D to Revenue | 0% | 0% | 0% |
High profitability margins and solid ROE signify efficient operations, reinforcing MAA's capacity to fulfill dividend commitments.
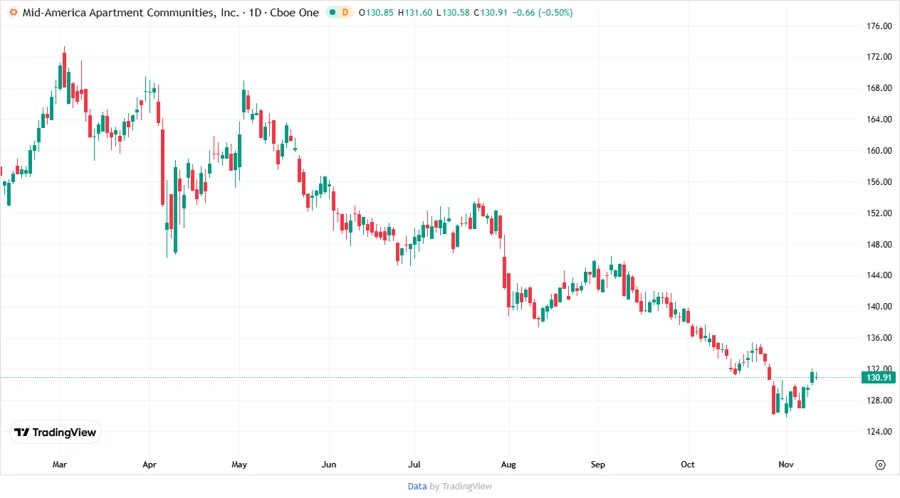
📉 Price Development
✅ Dividend Scoring System
| Criteria | Score | |
|---|---|---|
| Dividend Yield | 4 | |
| Dividend Stability | 5 | |
| Dividend Growth | 3 | |
| Payout Ratio | 2 | |
| Financial Stability | 4 | |
| Dividend Continuity | 5 | |
| Cashflow Coverage | 3 | |
| Balance Sheet Quality | 4 |
Total Score: 30/40
📝 Rating
Mid-America Apartment Communities, Inc. offers a compelling dividend proposition with its steady growth and robust history. While the payout ratio warrants caution, the overall financial stability and strong sector position make it a viable choice for dividend-seeking investors. Consider this stock to enhance portfolio income with a note of diligence towards payout metrics.
Smart Data Insight
Master the Perfect Entry & Exit for this Stock
Don't leave your profits to chance. Historically, this stock follows specific seasonal patterns that institutional traders use to maximize returns.
- ✅ Identify the "Golden Buying Window"
- ✅ Avoid high-risk correction cycles
- ✅ Backtested data from the last 20+ years