October 24, 2025 a 03:31 pm


MAA: Dividend Analysis - Mid-America Apartment Communities, Inc.
Mid-America Apartment Communities, Inc., a Real Estate Investment Trust (REIT), continues to attract attention with its substantial dividend yield and long-standing history of dividend payments. With a market capitalization of over $15 billion, the company has demonstrated a strong commitment to returning capital to shareholders, evidenced by 32 consecutive years of dividend payments without any reductions. However, its payout ratios suggest potential caution in the sustainability of current dividend levels.
📊 Overview
The following table provides key details about the dividend characteristics for Mid-America Apartment Communities, Inc.:
| Sector | Dividend Yield | Current Dividend Per Share | Dividend History | Last Cut or Suspension |
|---|---|---|---|---|
| REITs | 4.59% | $5.91 | 32 years | None |
🗣️ Dividend History
Historical dividend payments provide insight into the company's commitment to returning value to shareholders. Mid-America Apartment Communities, Inc. maintains an impressive streak of 32 years of increasing dividends, a testament to its resilience and operational stability.
| Year | Dividend Per Share |
|---|---|
| 2025 | $6.06 |
| 2024 | $5.88 |
| 2023 | $5.60 |
| 2022 | $4.675 |
| 2021 | $4.100 |
📈 Dividend Growth
Dividends have grown over recent years, reflecting the company's ability to generate increasing free cash flows and financial prudence.
| Time | Growth |
|---|---|
| 3 years | 12.77% |
| 5 years | 8.90% |
The average dividend growth is 8.90% over 5 years. This shows moderate but steady dividend growth.
✅ Payout Ratio
Payout ratios are critical to understanding how sustainable a company's dividends are. Here’s a breakdown of Mid-America Apartment Communities, Inc.'s current payout structure:
| Key Figure | Ratio |
|---|---|
| EPS-based | 121.01% |
| Free Cash Flow-based | 91.51% |
The EPS-based payout ratio signals that the company is paying out more in dividends than it earns, which may raise concerns about sustainability. However, the FCF-based ratio is within a more comfortable range, suggesting some flexibility in maintaining dividends.
🔍 Cashflow & Capital Efficiency
Assessing cash flow and capital efficiency provides insights into the company's operational capabilities and financial health:
| Year | 2024 | 2023 | 2022 |
|---|---|---|---|
| Free Cash Flow Yield | 4.30% | 5.08% | 4.21% |
| Earnings Yield | 2.92% | 3.53% | 3.52% |
| CAPEX to Operating Cash Flow | 29.35% | 30.01% | 27.98% |
| Stock Compensation to Revenue | 0.72% | 0.73% | 0.93% |
| Free Cash Flow / Operating Cash Flow | 70.65% | 69.99% | 72.02% |
The company's cash flow metrics reflect moderate free cash flow generation, which supports the current dividend policy. The capital efficiency ratios are favorable, indicating a solid return on invested capital.
⚠️ Balance Sheet & Leverage Analysis
A thorough analysis of leverage and liquidity helps gauge the company's financial flexibility and risk profile:
| Year | 2024 | 2023 | 2022 |
|---|---|---|---|
| Debt-to-Equity | 83.95% | 74.72% | 73.74% |
| Debt-to-Assets | 42.39% | 39.77% | 39.53% |
| Debt-to-Capital | 45.64% | 42.76% | 42.44% |
| Net Debt to EBITDA | 3.82x | 3.52x | 3.27x |
| Current Ratio | 7.53% | 5.19% | 10.94% |
| Quick Ratio | 7.53% | 5.19% | 10.94% |
| Financial Leverage | 1.98x | 1.88x | 1.87x |
The leverage metrics show an acceptable level of debt relative to assets and equity, suggesting well-managed financial obligations. However, liquidity ratios are relatively low, recommending careful monitoring of short-term financing needs.
🔍 Fundamental Strength & Profitability
Key profitability ratios and performance measures reveal operational efficiency and returns:
| Year | 2024 | 2023 | 2022 |
|---|---|---|---|
| Return on Equity | 8.84% | 9.04% | 10.58% |
| Return on Assets | 4.47% | 4.81% | 5.67% |
| Net Margin | 24.08% | 25.73% | 31.56% |
| EBIT Margin | 32.56% | 33.52% | 39.69% |
| EBITDA Margin | 59.32% | 59.85% | 66.63% |
| Gross Margin | 32.55% | 34.79% | 34.05% |
| R&D to Revenue | 0% | 0% | 0% |
The performance metrics indicate robust profitability with stable margins and returns, enhancing growth potential and value creation for shareholders.
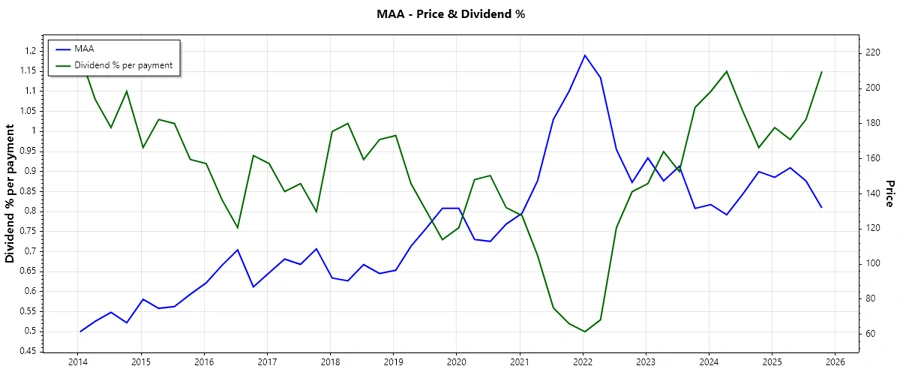
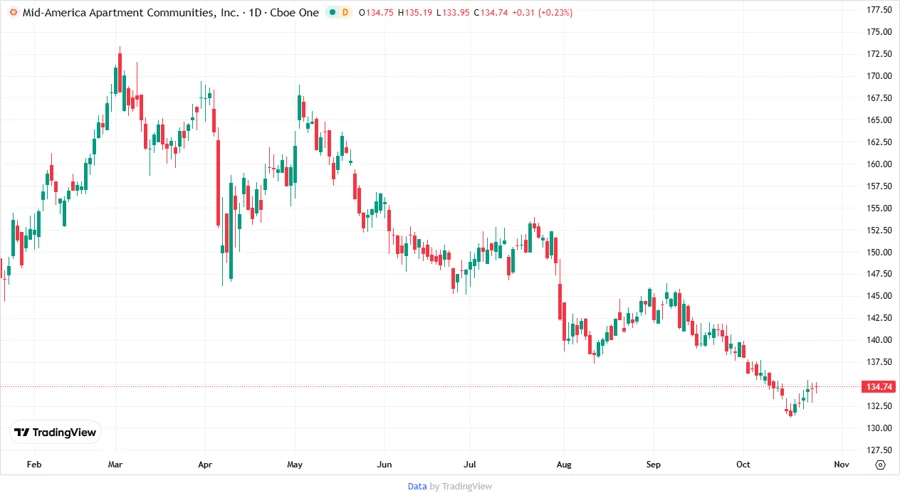
📉 Price Development
📈 Dividend Scoring System
Assessing each aspect of the dividend framework, here is our scoring:
| Category | Score | |
|---|---|---|
| Dividend Yield | 4 | |
| Dividend Stability | 5 | |
| Dividend Growth | 3 | |
| Payout Ratio | 2 | |
| Financial Stability | 3 | |
| Dividend Continuity | 5 | |
| Cashflow Coverage | 3 | |
| Balance Sheet Quality | 3 |
Total Score: 28/40
📊 Rating
Overall, Mid-America Apartment Communities, Inc. presents a mixed investment case. Its history of dividend stability and growth makes it an attractive option for income-focused investors. However, caution is advised due to relatively high payout ratios and the associated risk with maintaining such dividend levels in challenging economic conditions.
Smart Data Insight
Master the Perfect Entry & Exit for this Stock
Don't leave your profits to chance. Historically, this stock follows specific seasonal patterns that institutional traders use to maximize returns.
- ✅ Identify the "Golden Buying Window"
- ✅ Avoid high-risk correction cycles
- ✅ Backtested data from the last 20+ years