July 17, 2025 a 07:47 am


MAA: Dividend Analysis - Mid-America Apartment Communities, Inc.
Mid-America Apartment Communities, Inc. (MAA) presents an intriguing dividend profile with a significant yield of 5.08%. With a steady dividend history spanning 32 years and solid growth trends, investors could expect a stable income stream. However, close attention should be paid to the payout ratios, suggesting potential areas of concern regarding earnings coverage.
📊 Overview
Mid-America Apartment Communities operates within the Real Estate sector, providing a stable and potentially lucrative diversification for income-focused portfolios.
| Metric | Value |
|---|---|
| Sector | Real Estate |
| Dividend Yield | 5.08% |
| Current Dividend per Share | 5.91 USD |
| Dividend History | 32 years |
| Last Cut or Suspension | None |
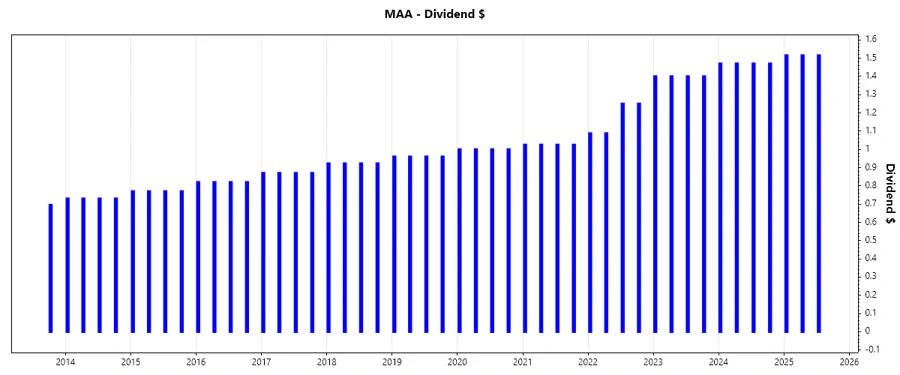
🗣️ Dividend History
The company has maintained an uninterrupted dividend payment history for over three decades, showcasing its commitment to returning capital to shareholders.
| Year | Dividend per Share (USD) |
|---|---|
| 2025 | 4.545 |
| 2024 | 5.88 |
| 2023 | 5.6 |
| 2022 | 4.675 |
| 2021 | 4.10 |
📈 Dividend Growth
Recent years have seen a modest increase in growth rates, indicating the potential for long-term capital gains alongside regular income.
| Time | Growth |
|---|---|
| 3 years | 12.77% |
| 5 years | 8.89% |
The average dividend growth is 8.89% over 5 years. This shows moderate but steady dividend growth.
💸 Payout Ratio
The payout ratio is a critical indicator of dividend sustainability. A higher EPS-based payout suggests that the company is paying more in dividends than it currently earns.
| Key figure | Ratio |
|---|---|
| EPS-based | 122.15% |
| Free Cash Flow-based | 83.92% |
An EPS payout ratio of 122.15% suggests earnings are not fully covering dividends, while a Free Cash Flow payout ratio of 83.92% shows better coverage, but still underlines the need for earnings growth.
Cashflow & Capital Efficiency
Understanding the cash flow situation is crucial for assessing financial health and sustainability of dividend payments.
| Metric | 2022 | 2023 | 2024 |
|---|---|---|---|
| Free Cash Flow Yield | 4.21% | 3.82% | 4.30% |
| Earnings Yield | 3.52% | 3.53% | 2.92% |
| CAPEX to Operating Cash Flow | 27.98% | 47.43% | 29.34% |
| Stock-based Compensation to Revenue | 0.93% | 0.73% | 0.00% |
| Free Cash Flow / Operating Cash Flow Ratio | 72.02% | 52.57% | 70.63% |
The data reflects a reasonable cash flow generation with a strong capacity to reinvest and remain competitive, highlighting capital efficiency with a focus on growth investments.
Balance Sheet & Leverage Analysis
An examination of the company's leverage and financial ratios offers insights into its balance sheet strength and financial flexibility.
| Metric | 2022 | 2023 | 2024 |
|---|---|---|---|
| Debt-to-Equity | 0.73 | 0.75 | 0.84 |
| Debt-to-Assets | 0.39 | 0.40 | 0.42 |
| Debt-to-Capital | 0.42 | 0.43 | 0.46 |
| Net Debt to EBITDA | 3.25 | 3.52 | 3.82 |
| Current Ratio | 0.10 | 0.06 | 0.08 |
| Quick Ratio | 0.10 | 0.06 | 0.08 |
| Financial Leverage | 1.87 | 1.88 | 1.98 |
The increase in debt-to-equity across the years suggests a rising debt level, yet the financial leverage ratio remains manageable, indicating prudent leverage utilization.
Fundamental Strength & Profitability
Profitability metrics such as ROE and margin ratios provide a glimpse into the company's financial adeptness and profit generation capabilities.
| Metric | 2022 | 2023 | 2024 |
|---|---|---|---|
| Return on Equity | 10.58% | 9.04% | 8.84% |
| Return on Assets | 5.67% | 4.81% | 4.47% |
| Net Margin | 31.56% | 25.73% | 24.08% |
| EBIT Margin | 39.69% | 33.52% | 32.56% |
| EBITDA Margin | 66.63% | 59.85% | 59.32% |
| Gross Margin | 34.05% | 34.79% | 32.55% |
Stable profit margins across the years underline efficient management and an ability to maintain profitability under varying market conditions.
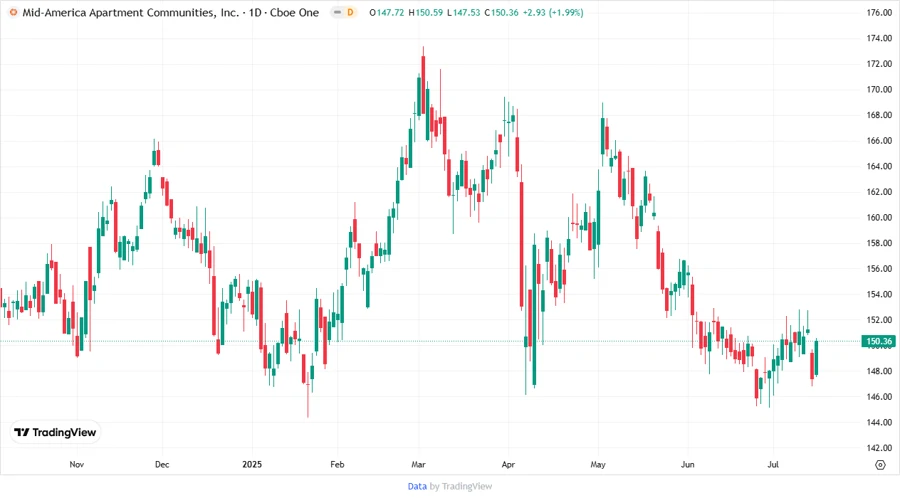
Price Development
Dividend Scoring System
| Criterion | Description | Score |
|---|---|---|
| Dividend yield | Attractive yield | 4 |
| Dividend Stability | Consistent history | 5 |
| Dividend growth | Modest growth | 3 |
| Payout ratio | High EPS ratio | 2 |
| Financial stability | Solid balance sheet | 4 |
| Dividend continuity | Long history | 5 |
| Cashflow Coverage | Adequate coverage | 3 |
| Balance Sheet Quality | Manageable leverage | 4 |
Total Score: 30/40
🔍 Rating
Given the robust historical performance and the steady cash flow generation, Mid-America Apartment Communities, Inc. receives a "Hold" rating. While the dividend yield remains attractive, attention should be given to the payout ratios and earnings sustainability to ensure the continued potential for future growth.
Smart Data Insight
Master the Perfect Entry & Exit for this Stock
Don't leave your profits to chance. Historically, this stock follows specific seasonal patterns that institutional traders use to maximize returns.
- ✅ Identify the "Golden Buying Window"
- ✅ Avoid high-risk correction cycles
- ✅ Backtested data from the last 20+ years