October 22, 2025 a 04:45 pm
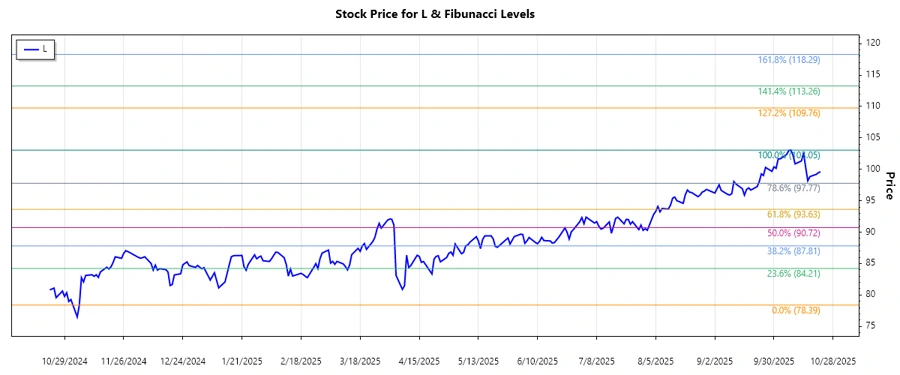
L: Fibonacci Analysis - Loews Corporation
The analysis of Loews Corporation's stock reveals a dynamic company active in diverse sectors, including insurance, natural gas transportation, and hotel management. The latest trend shows a significant rally in stock prices, suggesting a bullish market sentiment. Long-term holdings may benefit from the company's diverse business model and potential for steady growth.
Fibonacci Analysis
| Start Date | End Date | High Date | High Price | Low Date | Low Price |
|---|---|---|---|---|---|
| 2024-11-05 | 2025-10-22 | 2025-10-08 | 103.05 | 2024-11-05 | 78.39 |
| Fibonacci Level | Price Level |
|---|---|
| 0.236 | 86.6917 |
| 0.382 | 91.1863 |
| 0.5 | 95.72 |
| 0.618 | 100.2537 |
| 0.786 | 105.5233 |
As of now, the current price of 99.63 suggests that it is in the 0.618 retracement area, indicating potential resistance at this level. This level could act as a significant barrier if not breached, implying a period of consolidation or a possible correction before resuming upward momentum.
Conclusion
The upward trend in Loews Corporation's stock prices highlights a strong performance over the recent months, primarily due to its diversified operations. While the current Fibonacci retracement level suggests a potential resistance, the overall outlook remains positive. Investors should remain cautious of minor setbacks and focus on long-term growth prospects. The company's robust business model and presence in essential industries, like insurance and energy, provide a solid foundation for future value appreciation.
Smart Data Insight
Master the Perfect Entry & Exit for this Stock
Don't leave your profits to chance. Historically, this stock follows specific seasonal patterns that institutional traders use to maximize returns.
- ✅ Identify the "Golden Buying Window"
- ✅ Avoid high-risk correction cycles
- ✅ Backtested data from the last 20+ years