March 23, 2026 a 02:46 am

📊 Dividend Analysis - Loews Corporation
Loews Corporation, with a well-established history of 42 years of consistent dividend payments, remains a steadfast choice for income-focused investors. While the current dividend yield is modest, the company's strategy of maintaining dividends through various economic cycles highlights its commitment to providing shareholder value. Despite the lack of recent dividend growth, the substantial background underscores reliability and potential for future adjustments aligned with broader strategic goals.
🗣️ Overview
Engaging in the diversified sector, Loews Corporation shows a strategic approach towards dividend stability. Although the yield of 0.23% may appear modest, it ensures a steady distribution, driven by a robust 42-year dividend history without cuts.
| Sector | Dividend Yield (%) | Current Dividend Per Share (USD) | Dividend History Years | Last Cut or Suspension |
|---|---|---|---|---|
| Diversified | 0.23 | 0.25 | 42 | None |
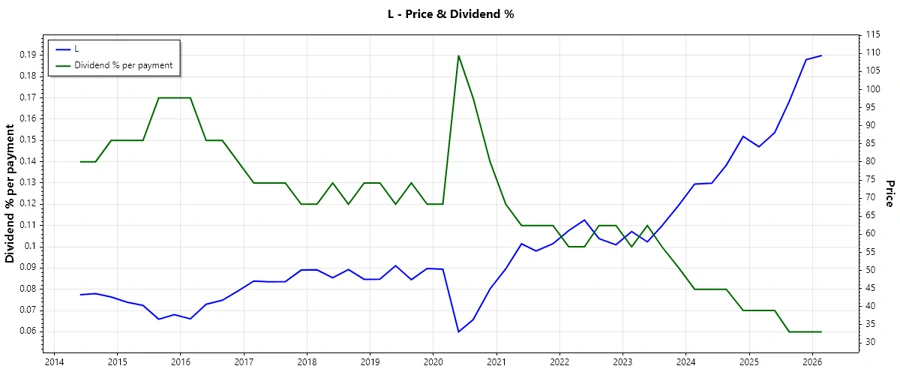
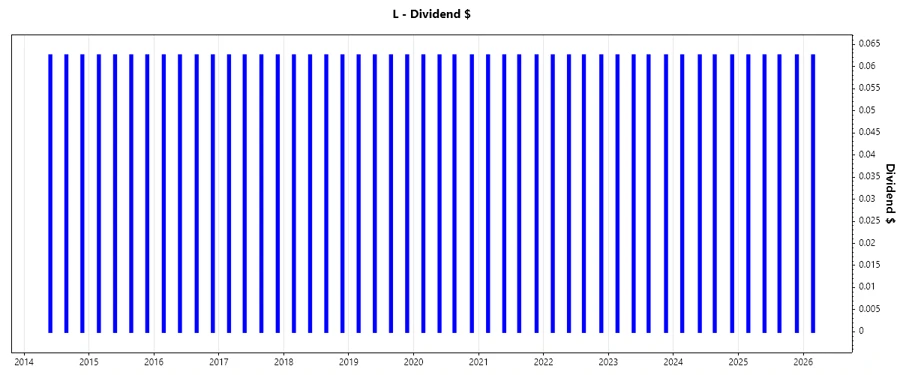
📈 Dividend History
The dividend history of Loews Corporation portrays reliability with uninterrupted payments spanning over four decades. This formidable track record showcases the company’s resilience in dividend stability, an appealing trait for long-term investors.
| Year | Dividend Per Share (USD) |
|---|---|
| 2026 | 0.0625 |
| 2025 | 0.2500 |
| 2024 | 0.2500 |
| 2023 | 0.2500 |
| 2022 | 0.2500 |
📉 Dividend Growth
Loews Corporation’s dividend growth metrics indicate a flat growth trajectory in the recent five years. Although stable, the absence of growth in the distribution could suggest a focus on internal reallocation of capital or potential strategic shifts.
| Time | Growth (%) |
|---|---|
| 3 years | 0 |
| 5 years | 0 |
The average dividend growth is 0% over 5 years. This shows stability without expansion, highlighting a secure but static approach to dividend policy.
✅ Payout Ratio
Assessing the payout ratios can serve as an insight into how well a company is balancing its income with its dividend payments. A lower payout might suggest retentive earning capabilities or cash flow alignment towards other growth objectives.
| Key Figure | Ratio (%) |
|---|---|
| EPS-based | 3.09 |
| Free cash flow-based | 1.74 |
With a modest EPS payout ratio of 3.09% and a free cash flow payout of 1.74%, Loews Corporation showcases a conservative and potentially sustainable financial policy, enabling future flexibility.
💰 Cashflow & Capital Efficiency
The evaluation of cash flow dynamics reflects the company's efficiency in transforming its revenues into operational and capital growth, emphasizing its financial vitality and adaptability.
| 2025 | 2024 | 2023 | |
|---|---|---|---|
| Free Cash Flow Yield | 12.26% | 12.83% | 20.35% |
| Earnings Yield | 7.57% | 7.58% | 9.06% |
| CAPEX to Operating Cash Flow | 17.66% | 20.89% | 17.56% |
| Stock-based Compensation to Revenue | 0% | 0% | 0.23% |
| Free Cash Flow / Operating Cash Flow Ratio | 82.34% | 79.11% | 82.44% |
The stability in cash flow and capital efficiency metrics suggests robust financial management and the potential for continued reinvestments or shareholder distributions.
🛡️ Balance Sheet & Leverage Analysis
Analyzing the balance sheet alongside leverage provides insights into Loews Corporation's financial structure and its ability to cover debts with assets, ensuring operational continuity amidst financial obligations.
| 2025 | 2024 | 2023 | |
|---|---|---|---|
| Debt-to-Equity | 0.51 | 0.52 | 0.57 |
| Debt-to-Assets | 0.11 | 0.11 | 0.11 |
| Debt-to-Capital | 0.34 | 0.34 | 0.36 |
| Net Debt to EBITDA | 3.31 | 2.90 | 2.96 |
| Current Ratio | 0.48 | 0.48 | 0.43 |
| Quick Ratio | 0.48 | 0.48 | 0.43 |
| Financial Leverage | 4.62 | 4.80 | 5.04 |
The financial leverage and debt ratios maintain a balanced outlook, keeping essential liquidity and solvency metrics within desirable bounds, fostering longer-term financial health.
🔍 Fundamental Strength & Profitability
Fundamentals and profitability metrics reflect the core efficacy of Loews Corporation's operations, elucidating its capability to generate value and uphold operational profitability.
| 2025 | 2024 | 2023 | |
|---|---|---|---|
| Return on Equity | 8.92% | 8.29% | 9.13% |
| Return on Assets | 1.93% | 1.73% | 1.81% |
| Net Profit Margin | 9.17% | 8.20% | 9.15% |
| EBIT Margin | 14.96% | 13.43% | 15.13% |
| EBITDA Margin | 18.32% | 16.81% | 18.56% |
| Gross Margin | 43.93% | 44.68% | 44.43% |
| Research & Development to Revenue | 0% | 0% | 0% |
Loews Corporation showcases firm profitability performance with consistent margins. Return rates indicate competent utilization of equity and assets to generate earnings, supporting influential financial strategies.
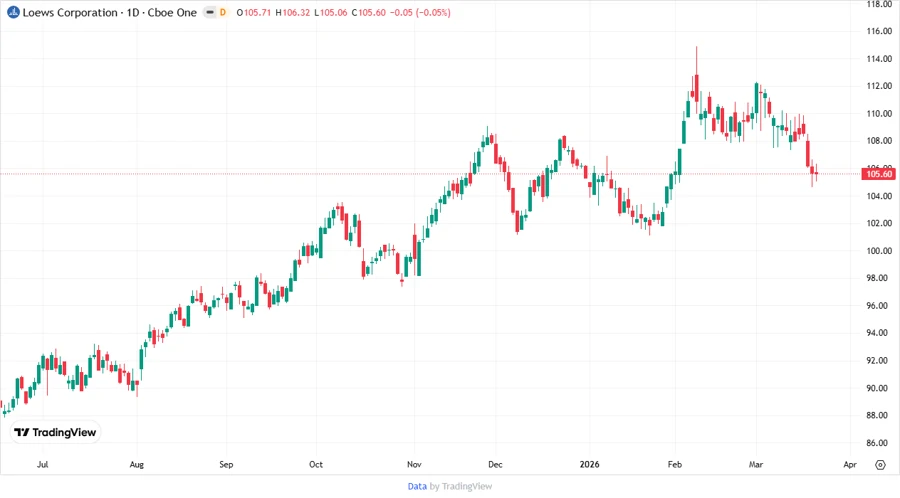
✈️ Price Development
🔢 Dividend Scoring System
| Criteria | Score | Proportion |
|---|---|---|
| Dividend yield | 2 | |
| Dividend Stability | 5 | |
| Dividend Growth | 1 | |
| Payout Ratio | 5 | |
| Financial Stability | 4 | |
| Dividend Continuity | 5 | |
| Cashflow Coverage | 4 | |
| Balance Sheet Quality | 4 |
Total Score: 30/40
🌐 Rating
Loews Corporation emerges as a reliable dividend payer with remarkable stability, though lacking in recent growth advancements. This profile suits investors prioritizing secure, consistent income over dynamic yield growth. The current strategy could be fortified through potential introductions of increment strategies fostering further shareholder returns in an ever-evolving market environment.
Smart Data Insight
Master the Perfect Entry & Exit for this Stock
Don't leave your profits to chance. Historically, this stock follows specific seasonal patterns that institutional traders use to maximize returns.
- ✅ Identify the "Golden Buying Window"
- ✅ Avoid high-risk correction cycles
- ✅ Backtested data from the last 20+ years