November 16, 2025 a 03:31 am

📊 Dividend Analysis - Loews Corporation
Loews Corporation, with its longstanding presence in the market, offers a consistent dividend track record, reflecting solid financial stewardship and resilience. Its dividend profile is enhanced by 41 years of continuous payouts, establishing trust and reliability among investors. However, the low dividend yield suggests a conservative payout strategy, focusing on financial stability and long-term growth.
Overview
Loews Corporation operates within the insurance, hospitality, and energy sectors, maintaining a diversified portfolio that balances risk and return. The company's dividend yield stands at 0.24%, coupled with a current dividend per share of $0.25 USD. This, along with a remarkable 41-year history of stable dividends and no recent cuts, signifies robust financial health and commitment to shareholder returns.
| Metric | Details |
|---|---|
| Sector | Insurance, Hospitality, Energy |
| Dividend Yield | 0.24% |
| Current Dividend per Share | $0.25 USD |
| Dividend History | 41 years |
| Last Cut or Suspension | None |
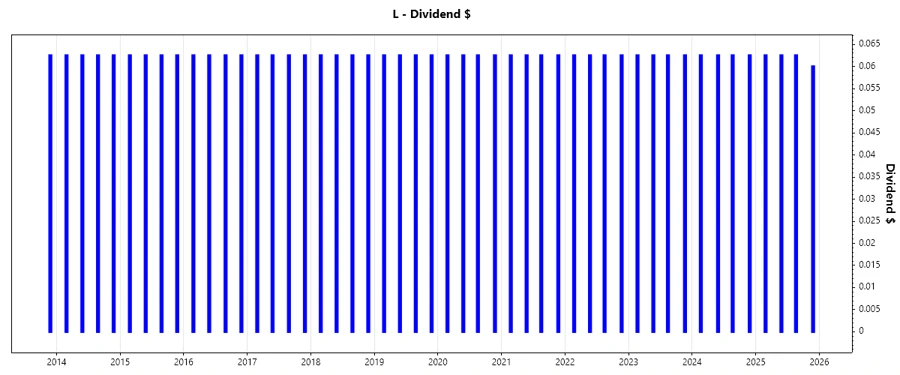
Dividend History
The dividend history of a company showcases its ability to generate consistent shareholder returns. With Loews Corporation's unwavering dividend distribution for over four decades, investors can be assured of its financial prowess and strategic forethought. The ability to maintain dividend payments through varying macroeconomic conditions is a testament to its sound financial management and policy priorities.
| Year | Dividend per Share (USD) |
|---|---|
| 2025 | $0.25 |
| 2024 | $0.25 |
| 2023 | $0.25 |
| 2022 | $0.25 |
| 2021 | $0.25 |
Dividend Growth
The absence of dividend growth over 3 and 5 years might initially raise concerns among growth-focused investors. However, it underscores the company's strategy to prioritize internal reinvestment and capital preservation over payout expansion. While this stagnant growth trend may not appeal to all investors, it ensures a steady income stream without compromising the corporation's financial scalability.
| Time | Growth |
|---|---|
| 3 years | 0% |
| 5 years | 0% |
The average dividend growth is 0% over 5 years. This shows moderate but steady dividend growth as the company prioritizes cost control and reinvestment.
Payout Ratio
Payout ratios are critical indicators of a company's dividend-paying ability. Loews Corporation maintains a modest EPS-based payout ratio of 3.60% and an FCF-based ratio of 1.57%. These metrics indicate a conservative approach, ensuring room for both operational flexibility and future payout capacity expansions.
| Key Figure Ratio | Percentage |
|---|---|
| EPS-based | 3.60% |
| Free Cash Flow-based | 1.57% |
The low EPS and FCF payout ratios denote a strategic reserve focus, offering stability and potential for enhancement in income distributions.
Cashflow & Capital Efficiency
Analyzing cash flow and capital efficiency allows insight into Loews Corporation's operational strength. With an impressive FCF yield and robust earnings yield, the firm efficiently utilizes its capital to engender profitable returns, exhibiting controlled CAPEX relative to its operating cash flow, which highlights prudent governance and scalability.
| Metric | 2022 | 2023 | 2024 |
|---|---|---|---|
| Free Cash Flow Yield | 18.74% | 20.35% | 12.83% |
| Earnings Yield | 5.80% | 9.06% | 7.58% |
| CAPEX to Operating Cash Flow | 19.92% | 17.56% | 20.89% |
| Stock-based Compensation to Revenue | 0.00% | 0.00% | 0.00% |
| Free Cash Flow / Operating Cash Flow Ratio | 80.08% | 82.44% | 79.11% |
Stable cash flow ratios affirm sufficient liquidity generation and judicious capital allocation, essential for sustaining long-term growth.
Balance Sheet & Leverage Analysis
Reviewing the balance sheet metrics highlights Loews Corporation's effective leverage management. The company exhibits a well-balanced debt structure characterized by moderate debt ratios and manageable net debt to EBITDA, underscoring its robust financial position and operational resilience.
| Metric | 2022 | 2023 | 2024 |
|---|---|---|---|
| Debt-to-Equity | 0.63 | 0.57 | 0.52 |
| Debt-to-Assets | 0.11 | 0.11 | 0.11 |
| Debt-to-Capital | 0.39 | 0.36 | 0.34 |
| Net Debt to EBITDA | 4.24 | 2.96 | 2.90 |
| Current Ratio | 0.00 | 0.00 | 0.00 |
| Quick Ratio | 0.00 | 0.00 | 0.00 |
| Financial Leverage | 5.26 | 5.04 | 4.80 |
Strategic leverage metrics mitigate risk and contribute to financial stability, supporting growth and crisis navigation.
Fundamental Strength & Profitability
Fundamental strength and profitability analysis are vital for evaluating long-term value creation. Loews Corporation's solid return fundamentals and positive margins reveal effective management practices aligned with shareholder interests, enhancing overall value proposition.
| Metric | 2022 | 2023 | 2024 |
|---|---|---|---|
| Return on Equity | 5.73% | 9.13% | 8.29% |
| Return on Assets | 1.09% | 1.81% | 1.73% |
| Margins: Net | 5.85% | 9.15% | 8.20% |
| Margins: EBIT | 10.62% | 15.13% | 13.43% |
| Margins: EBITDA | 14.24% | 18.56% | 16.81% |
| Margins: Gross | 42.04% | 44.43% | 44.68% |
| Research & Development to Revenue | 0.00% | 0.00% | 0.00% |
Strong profitability metrics reflect efficient utilization of assets and resources, enhancing competitive advantage and growth potential.
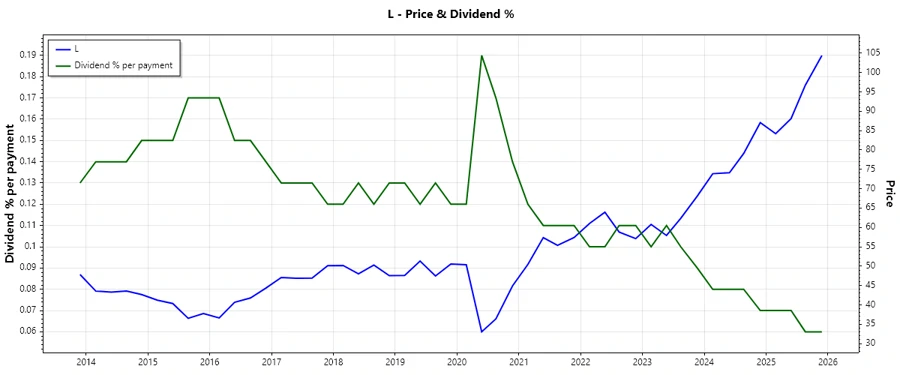
Price Development
Dividend Scoring System
| Criteria | Score | Indicator |
|---|---|---|
| Dividend Yield | 2 | |
| Dividend Stability | 5 | |
| Dividend Growth | 1 | |
| Payout Ratio | 5 | |
| Financial Stability | 4 | |
| Dividend Continuity | 5 | |
| Cashflow Coverage | 3 | |
| Balance Sheet Quality | 4 |
Total Score: 29 / 40
Rating
✅ Loews Corporation exhibits formidable financial health and operational resilience, supported by a robust dividend track record and prudent capital efficiency. While the yield and growth facets may appear conservative, the assurance of stability and sustainable payout capability, anchored by a strong balance sheet and judicious management, render Loews Corporation an attractive prospect for cautious income-seeking investors.
Smart Data Insight
Master the Perfect Entry & Exit for this Stock
Don't leave your profits to chance. Historically, this stock follows specific seasonal patterns that institutional traders use to maximize returns.
- ✅ Identify the "Golden Buying Window"
- ✅ Avoid high-risk correction cycles
- ✅ Backtested data from the last 20+ years