August 04, 2025 a 03:31 am


📊 Dividend Analysis - Loews Corporation
Loews Corporation exhibits a long-standing commitment to its shareholders by maintaining a stable dividend history for over four decades. Despite a relatively low dividend yield, the company's financial prudence is demonstrated by its modest payout ratios. With no recent dividend cuts or suspensions and a steady historical trajectory, Loews Corporation remains an intriguing prospect for income-focused investors prioritizing stability over high yields.
🗣️ Overview
Loews Corporation has been a reliable dividend payer, with consistent distributions over the past 41 years. This stability is crucial as it instills confidence in investors seeking long-term income streams. While the current dividend yield stands at a modest 0.28%, its steadfastness makes it appealing amidst volatile market conditions.
| Sector | Dividend Yield | Current Dividend per Share | Dividend History | Last Cut or Suspension |
|---|---|---|---|---|
| Conglomerate | 0.28% | $0.25 | 41 years | None |
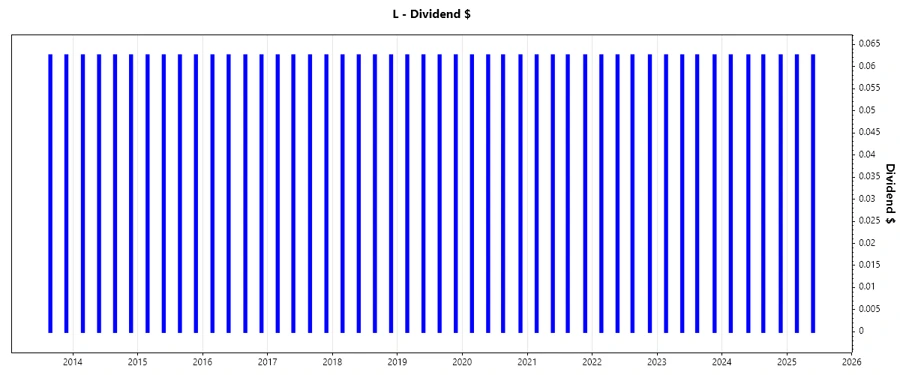
📈 Dividend History
Having a history of uninterrupted dividend payments is notable, as it reflects the company’s resilient cash flow management. With no cuts or suspensions, this history highlights Loews Corporation's enduring fiscal discipline and commitment to maintaining shareholder value.
| Year | Dividend per Share (USD) |
|---|---|
| 2025 | 0.1250 |
| 2024 | 0.2500 |
| 2023 | 0.2500 |
| 2022 | 0.2500 |
| 2021 | 0.2500 |
📉 Dividend Growth
The absence of dividend growth in the past three and five years could suggest a focus on maintaining stability rather than expansion. While this may not attract growth-seeking investors, it is conducive for those desiring consistency and reliability.
| Time | Growth |
|---|---|
| 3 years | 0% |
| 5 years | 0% |
The average dividend growth is 0% over 5 years. This shows moderate but steady dividend growth.
✅ Payout Ratio
The payout ratios are crucial indicators of a company’s ability to sustain its dividend payments. Loews Corporation's EPS-based payout ratio at 4.00% and FCF-based at 1.75% are both low, suggesting ample buffer to cover dividends, even in economic downturns.
| Key figure | Ratio |
|---|---|
| EPS-based | 4.00% |
| Free cash flow-based | 1.75% |
These low payout ratios indicate robust dividend coverage, mitigating risk of reductions and aligning with conservative financial management.
💲 Cashflow & Capital Efficiency
Loews Corporation demonstrates strong cash flow management prowess, essential for enduring operational and market challenges. High free cash flow yield indicates solid cash generation, crucial for funding dividends and growth initiatives.
| 2024 | 2023 | 2022 | |
|---|---|---|---|
| Free Cash Flow Yield | 12.83% | 20.35% | 18.74% |
| Earnings Yield | 7.58% | 9.06% | 5.80% |
| CAPEX to Operating Cash Flow | 20.89% | 17.56% | 19.92% |
| Stock-based Compensation to Revenue | 0% | 0.23% | 0.24% |
| Free Cash Flow / Operating Cash Flow Ratio | 79.11% | 82.44% | 80.08% |
This financial foundation grants Loews Corporation a competitive edge, supporting capital expenditure and reinvestment opportunities while ensuring dividend sustainability.
📊 Balance Sheet & Leverage Analysis
A solid balance sheet, reflected in moderate leverage ratios, enhances financial resilience and minimizes bankruptcy risk. Loews' conservative debt levels and reliable liquidity ratios underscore its capacity to navigate financial obligations efficiently.
| 2024 | 2023 | 2022 | |
|---|---|---|---|
| Debt-to-Equity | 52.41% | 57.33% | 62.85% |
| Debt-to-Assets | 10.91% | 11.37% | 11.95% |
| Debt-to-Capital | 34.39% | 36.44% | 38.60% |
| Net Debt to EBITDA | 2.90 | 2.95 | 5.23 |
| Current Ratio | N/A | N/A | N/A |
| Quick Ratio | N/A | N/A | N/A |
| Financial Leverage | 4.80 | 5.04 | 5.26 |
These stable leverage ratios ensure Loews Corporation's durability, enabling it to uphold financial obligations without compromising shareholder returns.
📈 Fundamental Strength & Profitability
Evaluating key profitability metrics, such as return on assets and equity, provides insights into the company’s efficiency in using its resources to generate profit.
| 2024 | 2023 | 2022 | |
|---|---|---|---|
| Return on Equity | 8.28% | 9.13% | 5.73% |
| Return on Assets | 1.73% | 1.81% | 1.09% |
| Net Margin | 8.20% | 9.15% | 5.85% |
| EBIT Margin | 13.43% | 15.13% | 7.93% |
| EBITDA Margin | 16.81% | 18.56% | 11.56% |
| Gross Margin | 44.68% | 44.43% | 42.06% |
| R&D to Revenue | 0% | 0% | 0% |
These metrics reveal Loews Corporation's stable profit potential, offering a foundation for future growth and consistent dividends.
🤑 Price Development
Dividend Scoring System 🎯
| Criteria | Score | Bar |
|---|---|---|
| Dividend Yield | 2 | |
| Dividend Stability | 5 | |
| Dividend Growth | 1 | |
| Payout Ratio | 5 | |
| Financial Stability | 4 | |
| Dividend Continuity | 5 | |
| Cashflow Coverage | 5 | |
| Balance Sheet Quality | 4 |
Total Score: 31/40
Rating ⭐
Loews Corporation's dividends are characterized by exceptional stability and a solid financial foundation, translating into low risk for income investors. While the growth rate has been stagnant, the company's robust cash flows and low payout ratios ensure that dividends remain secure, albeit not abundant. Overall, Loews is an excellent choice for risk-averse investors seeking reliable income rather than growth.
Smart Data Insight
Master the Perfect Entry & Exit for this Stock
Don't leave your profits to chance. Historically, this stock follows specific seasonal patterns that institutional traders use to maximize returns.
- ✅ Identify the "Golden Buying Window"
- ✅ Avoid high-risk correction cycles
- ✅ Backtested data from the last 20+ years