September 25, 2025 a 02:04 pm
LYV: Trend and Support & Resistance Analysis - Live Nation Entertainment, Inc.
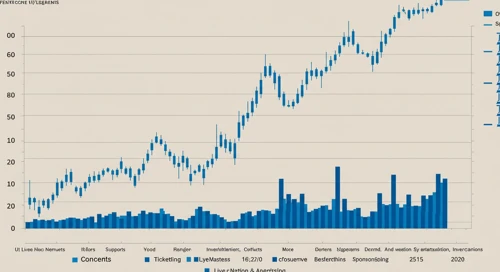
Live Nation Entertainment, Inc. (Ticker: LYV) is a major player in the live entertainment industry, predominantly known for its concert, ticketing, and sponsorship business segments. The stock has shown significant movement over the past few months, reflecting both the company's operational strengths and the prevailing market conditions. The analysis below will help in understanding key technical patterns and market sentiment. As live events continue to rebound in post-pandemic periods, LYV remains a company worth watching.
Trend Analysis
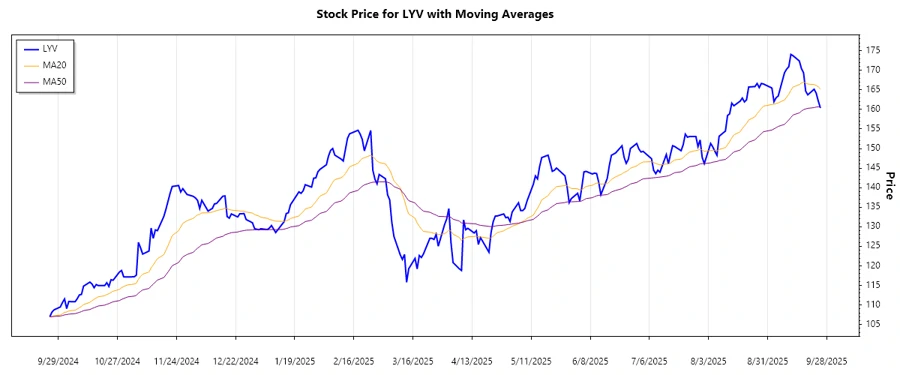
The stock has witnessed fluctuating trends over the examined period, influenced by various market dynamics and company performance. Utilizing the closing prices to calculate the Exponential Moving Averages (EMAs), we identify the EMA20 and EMA50 values to understand the current trend dynamics better.
| Date | Closing Price | Trend |
|---|---|---|
| 2025-09-25 | $160.34 | ▲ EMA20 > EMA50 |
| 2025-09-24 | $162.08 | ▲ EMA20 > EMA50 |
| 2025-09-23 | $164.13 | ▲ EMA20 > EMA50 |
| 2025-09-22 | $165.15 | ▲ EMA20 > EMA50 |
| 2025-09-19 | $163.72 | ▲ EMA20 > EMA50 |
| 2025-09-18 | $164.68 | ▲ EMA20 > EMA50 |
| 2025-09-17 | $169.37 | ▲ EMA20 > EMA50 |
Based on the EMA analysis, the stock is currently in an ▲ Uptrend as EMA20 > EMA50. This indicates a bullish momentum, suggesting that investors' sentiment is generally positive toward the stock.
Support and Resistance
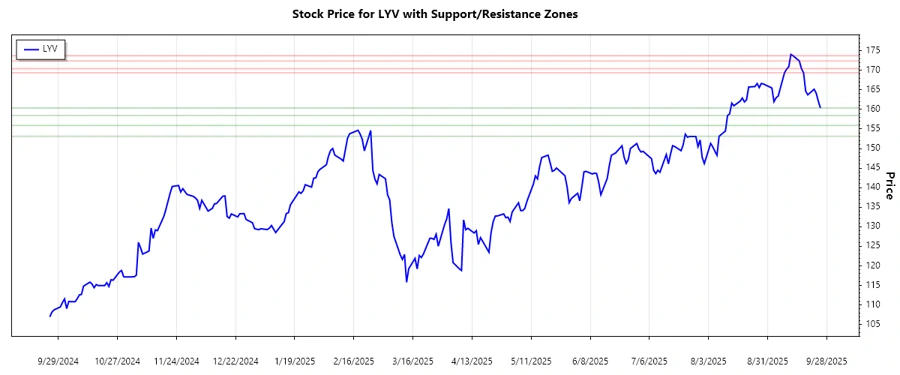
The following support and resistance zones have been determined based on historical closing prices which indicate areas where the stock price has, in the past, tended to reverse its direction.
| Support Zones | Resistance Zones |
|---|---|
| ▼ $158.43 to $160.34 | ▲ $169.37 to $170.42 |
| ▼ $153.13 to $155.92 | ▲ $172.38 to $173.73 |
The current stock price is within the ▲ Resistance zone of $169.37 to $170.42, suggesting that there could be a temporary slowdown or pause in upward momentum as the price approaches these areas.
Conclusion
The analysis of LYV's price trends and support & resistance levels indicates that the stock currently maintains an upward trajectory. A continuation of this trend could see the stock breaking past resistance levels, signaling strong investor confidence. However, caution is advised, as any reversal at the resistance zone could represent short-term risks. Analysts recommend keeping a close eye on market developments and company news that may impact stock dynamics. The current trend represents potential growth opportunities, provided market conditions remain supportive.
Smart Data Insight
Master the Perfect Entry & Exit for this Stock
Don't leave your profits to chance. Historically, this stock follows specific seasonal patterns that institutional traders use to maximize returns.
- ✅ Identify the "Golden Buying Window"
- ✅ Avoid high-risk correction cycles
- ✅ Backtested data from the last 20+ years