September 02, 2025 a 02:03 pm

LYV: Trend and Support & Resistance Analysis - Live Nation Entertainment, Inc.
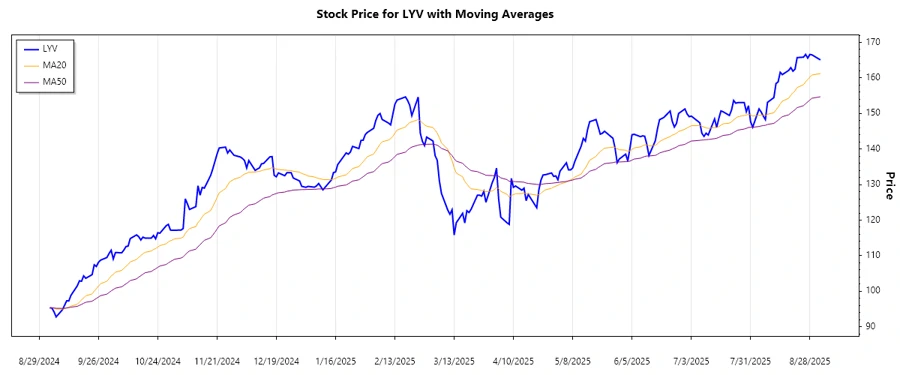
The stock of Live Nation Entertainment, Inc. (Ticker: LYV) has exhibited noteworthy movements over the past months. Analyzing the historical data, we can observe distinct trends and key price levels that offer insights into potential future movements. Utilizing EMA calculations, we identify trend dynamics that are instrumental in guiding investment decisions.
Trend Analysis
| Date | Close Price | Trend |
|---|---|---|
| 2025-09-02 | 165.07 | ▲ Upward |
| 2025-08-29 | 166.49 | ▲ Upward |
| 2025-08-28 | 166.62 | ▲ Upward |
| 2025-08-27 | 165.57 | ▲ Upward |
| 2025-08-26 | 166.62 | ▲ Upward |
| 2025-08-25 | 165.84 | ▲ Upward |
| 2025-08-22 | 165.72 | ▲ Upward |
The stock displays a prevailing upward trend as the EMA20 surpasses the EMA50, indicating sustained bullish momentum within the last seven days.
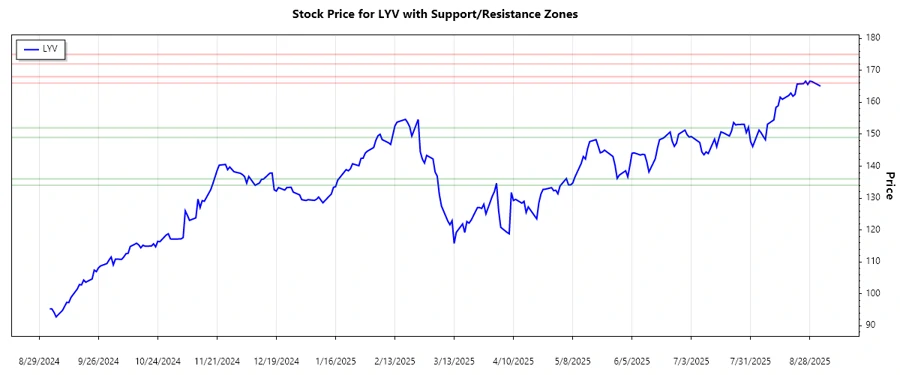
Support and Resistance
| Type | Zone Range |
|---|---|
| Support Zone | ▼ 149.00 - 152.00 |
| Support Zone | ▼ 134.00 - 136.00 |
| Resistance Zone | ▲ 166.00 - 168.00 |
| Resistance Zone | ▲ 172.00 - 175.00 |
Currently, the stock is trading within the resistance zone of 166.00 - 168.00, which could pose a short-term barrier.
Conclusion
The technical analysis of Live Nation Entertainment's stock indicates an ongoing upward trend. The presence in the resistance zone suggests potential consolidation or breakout scenarios. The stock's recent momentum could continue unless met with significant selling pressure at higher resistance levels. Investors may benefit from monitoring these key zones closely. Overall, the stock presents opportunities contingent upon upcoming price actions and sustained volume trends.
Smart Data Insight
Master the Perfect Entry & Exit for this Stock
Don't leave your profits to chance. Historically, this stock follows specific seasonal patterns that institutional traders use to maximize returns.
- ✅ Identify the "Golden Buying Window"
- ✅ Avoid high-risk correction cycles
- ✅ Backtested data from the last 20+ years