August 10, 2025 a 04:45 pm

LYV: Fibonacci Analysis - Live Nation Entertainment, Inc.
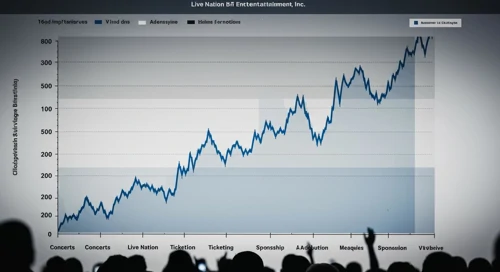
Live Nation Entertainment, Inc. is currently under technical scrutiny given its recent stock movements. Over the past few months, it has demonstrated a significant trend, which sets the stage for a detailed Fibonacci analysis. This analysis offers insights into potential support and resistance levels, assisting investors in making informed decisions.
Fibonacci Analysis
| Attribute | Details |
|---|---|
| Trend Start Date | 2024-08-12 |
| Trend End Date | 2025-08-08 |
| High Price | $153.13 (2025-08-08) |
| Low Price | $91.60 (2024-08-12) |
| 0.236 Level | $106.15 |
| 0.382 Level | $115.89 |
| 0.5 Level | $122.37 |
| 0.618 Level | $128.85 |
| 0.786 Level | $137.59 |
| Current Retracement Zone | 0.618 |
| Technical Interpretation | The current level suggests potential support. If it holds, an upward reversal might ensue. |
Conclusion
Live Nation Entertainment, Inc. has experienced a notable uptrend over the past year, bringing its stock price to recent highs. Current positioning within the Fibonacci retracement suggests a tactical support level, offering potential for upward momentum. However, if breached, it could imply further downside risk. Investors should consider both macroeconomic factors and sector-specific dynamics. Technically, maintaining above the 0.618 level supports continuation of the upward trend, while a dip below could call for re-evaluation. Vigilance in monitoring price action against key levels is crucial for decision-making.
Smart Data Insight
Master the Perfect Entry & Exit for this Stock
Don't leave your profits to chance. Historically, this stock follows specific seasonal patterns that institutional traders use to maximize returns.
- ✅ Identify the "Golden Buying Window"
- ✅ Avoid high-risk correction cycles
- ✅ Backtested data from the last 20+ years