February 09, 2026 a 09:03 am

LYB: Trend and Support & Resistance Analysis - LyondellBasell Industries N.V.
LyondellBasell Industries N.V., a leading company in the chemical sector, operates globally and offers a diverse range of products. The stock has shown significant fluctuations recently, and an analysis of current data suggests a notable trend. As the chemical industry continues to evolve, investors should consider both macroeconomic factors and sector-specific dynamics when evaluating LYB's potential.
Trend Analysis
| Date | Close Price | Trend |
|---|---|---|
| 2026-02-06 | 55.1 | ▲ Upward |
| 2026-02-05 | 53.88 | ▲ Upward |
| 2026-02-04 | 57.1 | ▲ Upward |
| 2026-02-03 | 53.45 | ▲ Upward |
| 2026-02-02 | 50.25 | ▼ Downward |
| 2026-01-30 | 49 | ▼ Downward |
| 2026-01-29 | 49.95 | ▼ Downward |
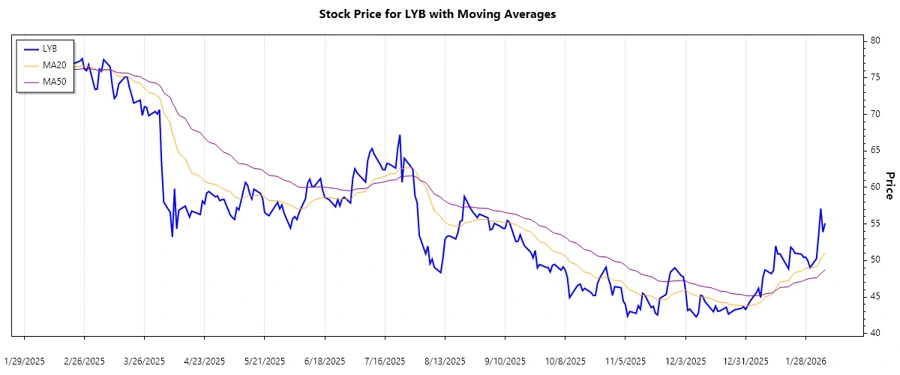
Trend analysis reveals a recent upward momentum, with the EMA20 crossing above the EMA50, confirming a bullish phase.
Support and Resistance
| Zone Type | Zone Range |
|---|---|
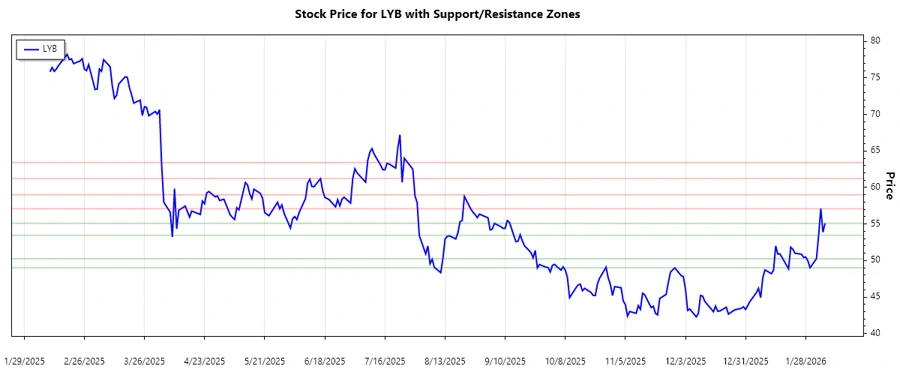
| Support Zone 1 | ▲ 49 - 50.25 |
| Support Zone 2 | ▲ 53.45 - 55.1 |
| Resistance Zone 1 | ▼ 57.1 - 59 |
| Resistance Zone 2 | ▼ 61.22 - 63.42 |
Currently, the stock price is nearing the first resistance zone. Evaluating whether it will break past this level will be crucial in estimating future price actions.
Conclusion
The LYB stock demonstrates an emerging bullish trend, as indicated by recent price movements and technical indicators. However, approaching resistance levels may pose challenges. Investors should weigh the potential for breakout against the risk of reversal, considering broader market conditions and inherent industry risks. Continuous monitoring of support and resistance zones can offer strategic entry and exit points.