November 16, 2025 a 08:15 am
LYB: Trend and Support & Resistance Analysis - LyondellBasell Industries N.V.
LyondellBasell Industries N.V. (ticker: LYB) operates in a diverse chemical sector, presenting unique opportunities and challenges. An analysis of recent trends suggests noticeable shifts indicative of broader market movements. Investors should consider both the technical and fundamental aspects of the company, especially given its broad international operations. The recent data points to a dominant trend and identifies critical support and resistance zones that could guide future price action. Understanding these dynamics is crucial for both short-term trades and long-term investment strategies.
Trend Analysis
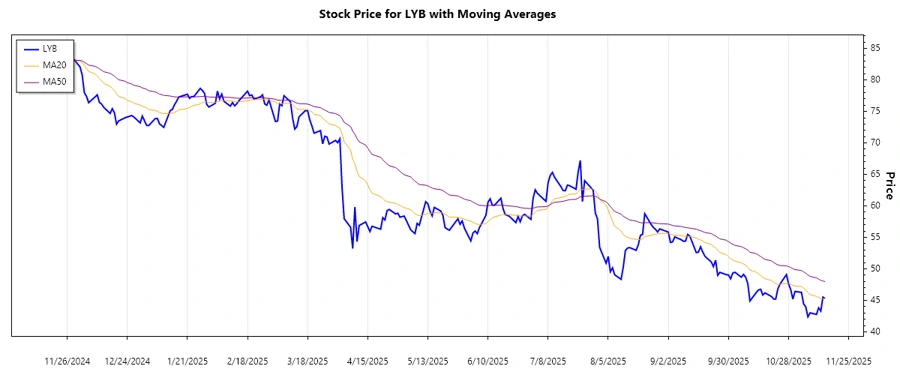
Recent historical data reveals significant fluctuations in LYB's stock price. To better understand the trend, we calculate the EMA20 and EMA50. Observations from the average moving trends provide insights into the stock's current movement and possible future direction.
| Date | Closing Price | Trend |
|---|---|---|
| 2025-11-14 | $45.3 | ▼ Down |
| 2025-11-13 | $45.52 | ▼ Down |
| 2025-11-12 | $43.31 | ▼ Down |
| 2025-11-11 | $43.82 | ▼ Down |
| 2025-11-10 | $42.77 | ▼ Down |
| 2025-11-07 | $43.02 | ▼ Down |
| 2025-11-06 | $42.38 | ▼ Down |
Recent trend analysis indicates a prevalent downtrend as evidenced by the EMA calculations with the EMA20 falling below the EMA50.
Support and Resistance
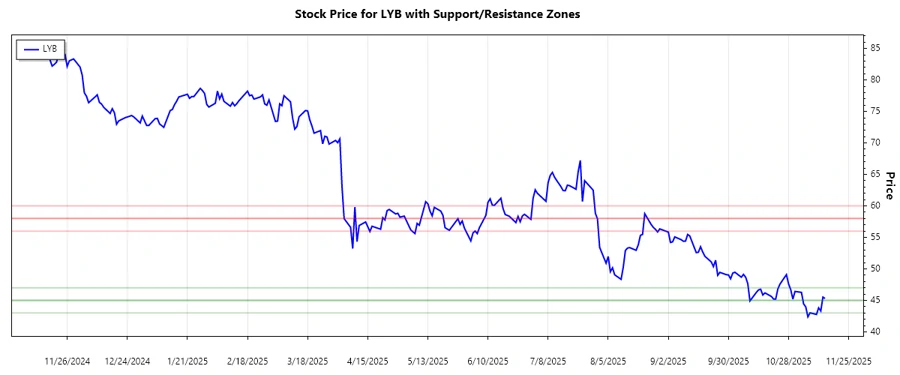
By examining recent closing prices, we identify two major support and resistance zones that LYB’s stock price tends to move within. These levels act as psychological barriers for traders.
| Zone Type | Lower Bound | Upper Bound |
|---|---|---|
| Resistance ▲ | $58.00 | $60.00 |
| Resistance ▲ | $56.00 | $58.00 |
| Support ▼ | $45.00 | $47.00 |
| Support ▼ | $43.00 | $45.00 |
The current price lies within the lower support zone, signaling a potential area for buyers to emerge.
Conclusion
The technical analysis of LyondellBasell Industries N.V. suggests a downward trend, with current price levels testing major support zones. Investors should remain cautious as breaking these levels might signal further declines, while holding could present buying opportunities. The current market dynamics, reflected in the stock’s behavior, underscore the importance of understanding both technical barriers and the broader economic context in which LYB operates. Potential recovery is plausible if support levels hold, but vigilance is advised amidst this volatile environment.
Smart Data Insight
Master the Perfect Entry & Exit for this Stock
Don't leave your profits to chance. Historically, this stock follows specific seasonal patterns that institutional traders use to maximize returns.
- ✅ Identify the "Golden Buying Window"
- ✅ Avoid high-risk correction cycles
- ✅ Backtested data from the last 20+ years