November 03, 2025 a 04:03 am
LYB: Trend and Support & Resistance Analysis - LyondellBasell Industries N.V.
LyondellBasell Industries N.V. has shown a mixed performance in recent months, reflecting the dynamic chemical industry's complexities in the global market. While recent trends indicate fluctuation in its stock price, technical indicators can provide insights into potential future performance. Evaluating key trends and support and resistance levels can assist investors in understanding potential price movements and aligning their investment strategies. Focusing on technical analysis can offer an edge in navigating the stock's volatile nature.
Trend Analysis
| Date | Closing Price | Trend |
|---|---|---|
| 2025-10-31 | 46.42 | ▼ |
| 2025-10-30 | 45.20 | ▼ |
| 2025-10-29 | 46.71 | ▼ |
| 2025-10-28 | 47.61 | ▼ |
| 2025-10-27 | 49.09 | ▼ |
| 2025-10-24 | 47.59 | ▼ |
| 2025-10-23 | 46.81 | ▼ |
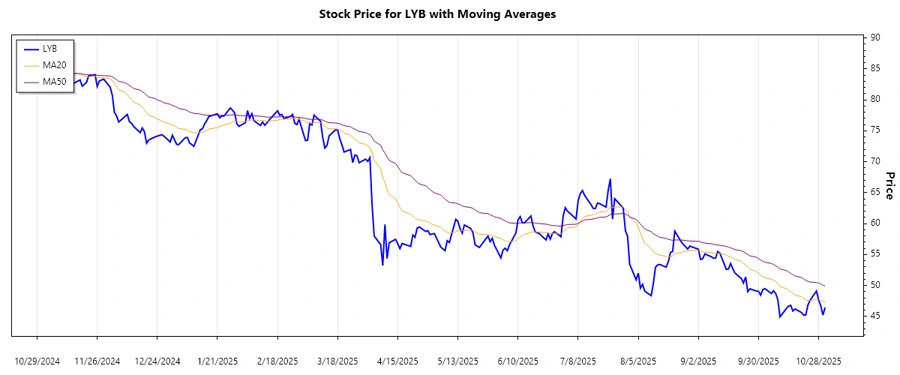
The analysis of the EMA20 and EMA50 over the recent period indicates a prevailing downtrend in the stock price. With the EMA20 remaining consistently below the EMA50, the outlook appears bearish. This signals potential caution for investors looking to enter the market at this point.
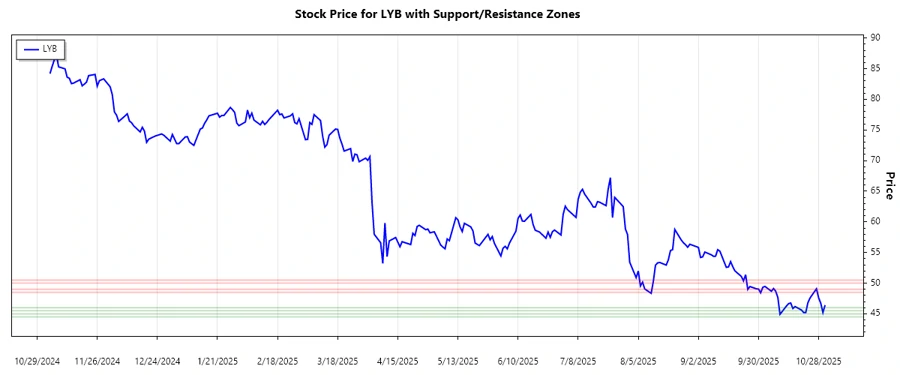
Support and Resistance
| Zone Type | From | To |
|---|---|---|
| Support 1 | 44.5 | 45.0 |
| Support 2 | 45.5 | 46.0 |
| Resistance 1 | 48.5 | 49.0 |
| Resistance 2 | 50.0 | 50.5 |
The current price position suggests that the stock is close to the identified support zones, which could act as potential buying areas. However, a break below these supports may indicate further downside risk.
Conclusion
In conclusion, LyondellBasell Industries N.V. is experiencing a bearish phase as indicated by key technical indicators analyzed. Investors should be prepared for potential volatility around key support zones. While these levels may offer buying opportunities, caution is advised due to the prevailing downtrend. Evaluation of the broader market conditions and industry-specific factors should complement the technical insights for a more informed decision-making process.
Smart Data Insight
Master the Perfect Entry & Exit for this Stock
Don't leave your profits to chance. Historically, this stock follows specific seasonal patterns that institutional traders use to maximize returns.
- ✅ Identify the "Golden Buying Window"
- ✅ Avoid high-risk correction cycles
- ✅ Backtested data from the last 20+ years