June 20, 2026 a 06:00 pm

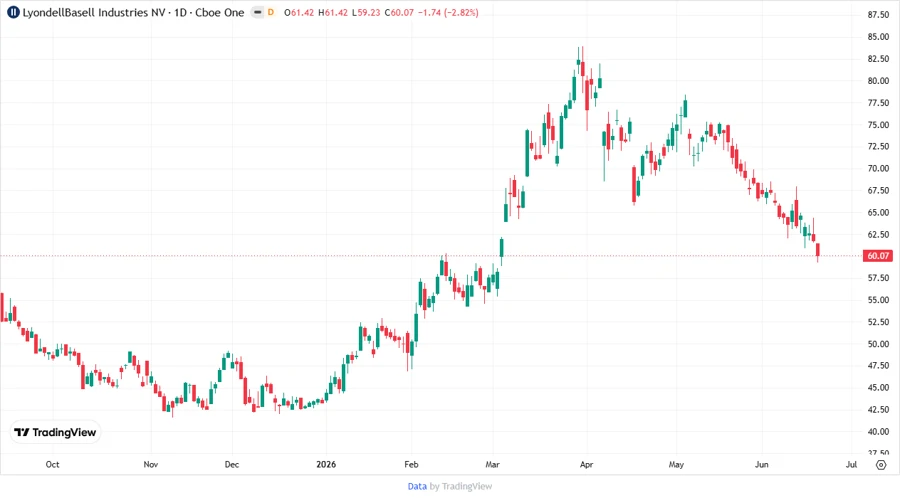
LYB: Fundamental Ratio Analysis - LyondellBasell Industries N.V.
LyondellBasell Industries N.V. remains a substantial player in the global chemical market, consistently navigating various economic cycles. While the company faces competitive pressures, its diversified product offerings and international reach provide a robust platform for growth. Their recent financial metrics suggest moderate stability with room for improvement.
Fundamental Rating
The fundamental analysis of LyondellBasell Industries N.V. reveals a mixed performance, with varying scores across key financial metrics.
| Category | Score | Visual |
|---|---|---|
| Discounted Cash Flow | 5 | |
| Return on Equity | 1 | |
| Return on Assets | 1 | |
| Debt to Equity | 1 | |
| Price to Earnings | 1 | |
| Price to Book | 2 |
Historical Rating
Comparing the dated scores showcases how LyondellBasell's financial performance indicators have shifted over time.
| Date | Overall Score | DCF | ROE | ROA | D/E | P/E | P/B |
|---|---|---|---|---|---|---|---|
| 2026-06-18 | 2 | 5 | 1 | 1 | 1 | 1 | 2 |
| Historical | 0 | 5 | 1 | 1 | 1 | 1 | 2 |
Analyst Price Targets
The analyst price targets highlight the range within which LYB is expected to trade, based on current market conditions.
| High | Low | Median | Consensus |
|---|---|---|---|
| $100 | $53 | $76 | $80.2 |
Analyst Sentiment
Analyst sentiment provides insight into market confidence, reflecting a more conservative outlook with a majority of 'Hold' recommendations.
| Recommendation | Count | Visual |
|---|---|---|
| Strong Buy | 1 | |
| Buy | 16 | |
| Hold | 19 | |
| Sell | 3 | |
| Strong Sell | 0 |
Conclusion
LyondellBasell Industries N.V. has demonstrated resilience in the chemical industry despite a challenging market environment. The current financial metrics suggest some operational efficiencies are needed to enhance investor confidence. Analyst sentiment around the 'Hold' consensus shows guarded optimism. The stock's price targets reflect the potential for growth if key performance indicators improve. Overall, LYB presents opportunities, albeit with caution towards its ongoing financial adjustments.
Smart Data Insight
Master the Perfect Entry & Exit for this Stock
Don't leave your profits to chance. Historically, this stock follows specific seasonal patterns that institutional traders use to maximize returns.
- ✅ Identify the "Golden Buying Window"
- ✅ Avoid high-risk correction cycles
- ✅ Backtested data from the last 20+ years