June 22, 2026 a 02:46 am
LYB: Dividend Analysis - LyondellBasell Industries N.V.
LyondellBasell Industries presents a mixed dividend profile. Although it offers an attractive dividend yield of 6.14%, reflecting its focus on rewarding shareholders, the negative dividend growth over the past three years is a concern for long-term income investors. With 16 years of dividend history, it maintains a solid track record, yet recent financial figures indicate caution in sustaining these dividends amid fluctuating earnings.
📊 Overview
LyondellBasell Industries operates within the Basic Materials sector, which is known for capital-intensive operations and cyclical demand fluctuations. The company's dividend yield stands at 6.14% with a current dividend of 5.48 USD per share. The business has maintained dividend payments for 16 consecutive years, a commendable achievement, albeit with a cautious note due to volatile earnings. There has been no recent dividend cut or suspension, underscoring its commitment to shareholder returns.
| Metric | Details |
|---|---|
| Sector | Basic Materials |
| Dividend yield | 6.14% |
| Current dividend per share | 5.48 USD |
| Dividend history | 16 years |
| Last cut or suspension | None |
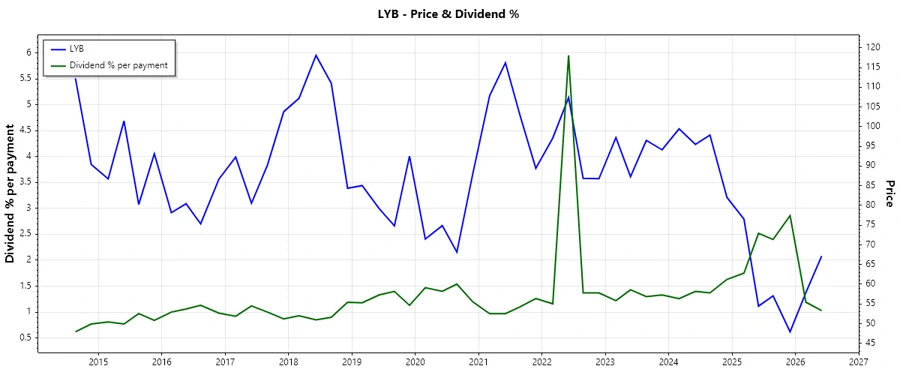
📈 Dividend History
The dividend history reflects the company's commitment to providing shareholder value through consistent dividends. This is crucial for income-focused investors as it indicates financial prudence and management's confidence in future cash flows. However, historical payout irregularities can be seen, which deserve attention in strategic investment decisions.
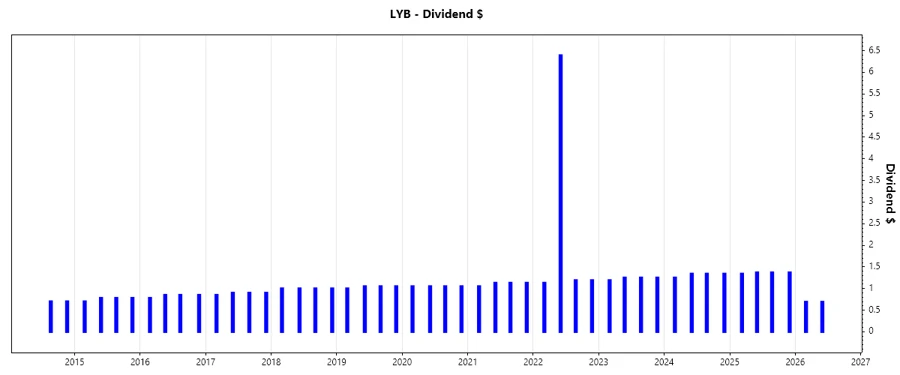
| Year | Dividend per Share (USD) |
|---|---|
| 2026 | 1.38 |
| 2025 | 5.45 |
| 2024 | 5.27 |
| 2023 | 4.94 |
| 2022 | 9.90 |
📊 Dividend Growth
Dividend growth is a significant indicator of a company's future outlook and financial health. LyondellBasell Industries has experienced a slight decline in dividend growth over the past three years, counterbalanced by a modest increase over the past five years. Such metrics are essential for assessing the sustainability and expansion potential of dividend-sourced income.
| Time | Growth |
|---|---|
| 3 years | -0.18% |
| 5 years | 5.35% |
The average dividend growth is 5.35% over 5 years. This shows moderate but steady dividend growth.
📈 Payout Ratio
The payout ratio offers insight into how much of the company's earnings are distributed as dividends. An EPS-based payout ratio of -222.45% is concerning, reflecting a current unsustainable financial distribution. In contrast, the free cash flow (FCF) payout ratio of 74.99% indicates a more grounded approach using cash flow for dividends.
| Key figure | Ratio (%) |
|---|---|
| EPS-based | -222.45% |
| Free cash flow-based | 74.99% |
The EPS payout ratio suggests financial distress, while the FCF ratio reflects a healthier but still relatively high commitment to dividend payments.
📊 Cashflow & Capital Efficiency
Cashflow and capital efficiency are vital in understanding operational and investment priorities, impacting dividend sustainability. LyondellBasell's metrics suggest mixed cash fluidity and allocation prudence, necessitating cautious observation amid operational fluctuations.
| Metric | 2025 | 2024 | 2023 |
|---|---|---|---|
| Free Cash Flow Yield | 2.75% | 8.20% | 11.04% |
| Earnings Yield | -5.33% | 5.63% | 6.84% |
| CAPEX to Operating Cash Flow | 83.02% | 48.15% | 30.98% |
| Stock-based Compensation to Revenue | 0.30% | 0.23% | 0.00% |
| Free Cash Flow / Operating Cash Flow Ratio | 16.98% | 51.84% | 69.02% |
These metrics indicate fluctuating cash flow stability and capital adequacy, demanding strategic shifts for enhanced fiscal efficiency and dividend optimism.
📊 Balance Sheet & Leverage Analysis
The balance sheet and leverage ratios help assess the financial stability of the company, revealing its capacity to endure economic shocks. LyondellBasell's leverage depicts significant debt levels, requiring prudent financial management to maintain liquidity and strategic operations.
| Metric | 2025 | 2024 | 2023 |
|---|---|---|---|
| Debt-to-Equity | 1.58 | 1.04 | 1.01 |
| Debt-to-Assets | 46.94% | 36.15% | 35.14% |
| Debt-to-Capital | 61.29% | 50.91% | 50.14% |
| Net Debt to EBITDA | 10.56 | 2.65 | 2.07 |
| Current Ratio | 1.77* | 1.83* | 1.84* |
| Quick Ratio | 1.19* | 1.13* | 1.17* |
| Financial Leverage | 3.37 | 2.87 | 2.86 |
The company's leverage ratios indicate high borrowing reliance, posing risks but also potential reward opportunities with effective debt management.
📉 Fundamental Strength & Profitability
Analyzing fundamental strength and profitability aids in understanding operational success and market competitiveness. The observed metrics reveal a need for improved returns and margin expansions to meet industry benchmarks and sustain market leadership.
| Metric | 2025 | 2024 | 2023 |
|---|---|---|---|
| Return on Equity | -7.37% | 10.91% | 16.35% |
| Return on Assets | -2.19% | 3.80% | 5.71% |
| Net Margin | -2.46% | 3.37% | 5.14% |
| Gross Margin | 9.00% | 11.32% | 12.79% |
| EBIT Margin | -0.68% | 5.17% | 7.55% |
| EBITDA Margin | 3.93% | 8.95% | 11.28% |
| Research & Development to Revenue | 0.47% | 0.33% | 0.32% |
The company's fundamental metrics call for strategic focus on improving profitability and operational efficiencies to drive future growth.
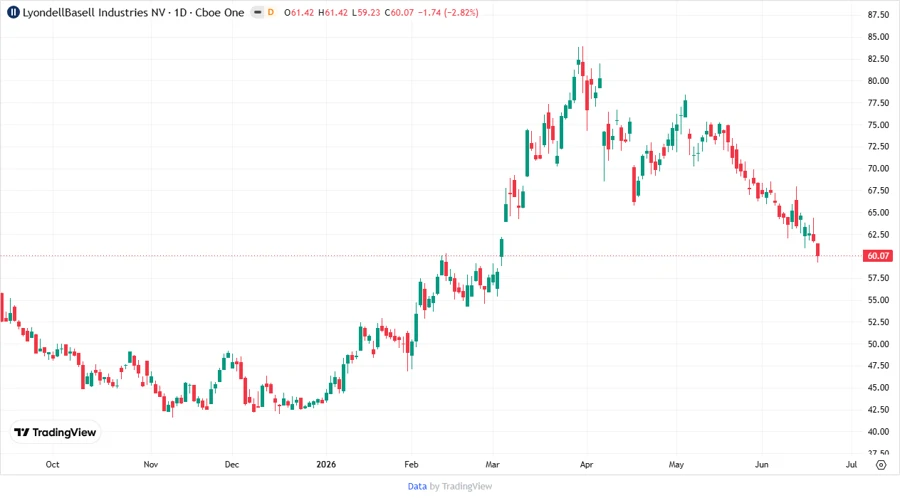
📈 Price Development
📊 Dividend Scoring System
| Criteria | Score | Score Bar |
|---|---|---|
| Dividend yield | 4 | |
| Dividend Stability | 3 | |
| Dividend Growth | 2 | |
| Payout Ratio | 2 | |
| Financial Stability | 3 | |
| Dividend Continuity | 4 | |
| Cashflow Coverage | 3 | |
| Balance Sheet Quality | 2 |
Total Score: 23/40
✅ Rating
LyondellBasell Industries presents a nuanced dividend profile, characterized by a strong yield and historical payout consistency. However, potential investors should be aware of recent financial instabilities and leverage concerns before committing. The dividend system scores 23 out of 40, indicating an average performance with areas needing strategic oversight and improvement for future robust dividend growth and stability.
Smart Data Insight
Master the Perfect Entry & Exit for this Stock
Don't leave your profits to chance. Historically, this stock follows specific seasonal patterns that institutional traders use to maximize returns.
- ✅ Identify the "Golden Buying Window"
- ✅ Avoid high-risk correction cycles
- ✅ Backtested data from the last 20+ years