
June 05, 2026 a 11:31 am
LYB: Dividend Analysis - LyondellBasell Industries N.V.
LyondellBasell Industries N.V. demonstrates a robust dividend yield standing at 6.14%, amidst fluctuating growth rates over the past few years. Despite experiencing intermittent cuts, its long history of 16 years in dividend payments highlights a dedication to returning capital to shareholders. However, investors should closely monitor its high EPS-based payout ratio which suggests earnings pressure.
📊 Overview
| Metric | Value |
|---|---|
| Sector | Chemicals |
| Dividend Yield | 6.14% |
| Current Dividend per Share | 5.48 USD |
| Dividend History | 16 years |
| Last Cut or Suspension | None |
🗣️ Dividend History
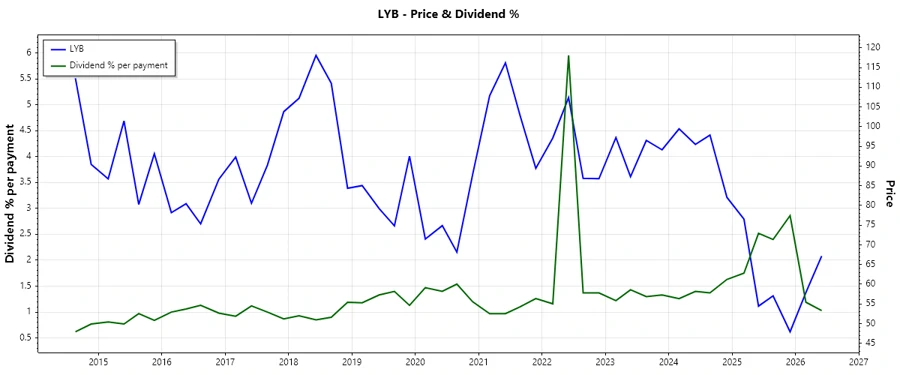
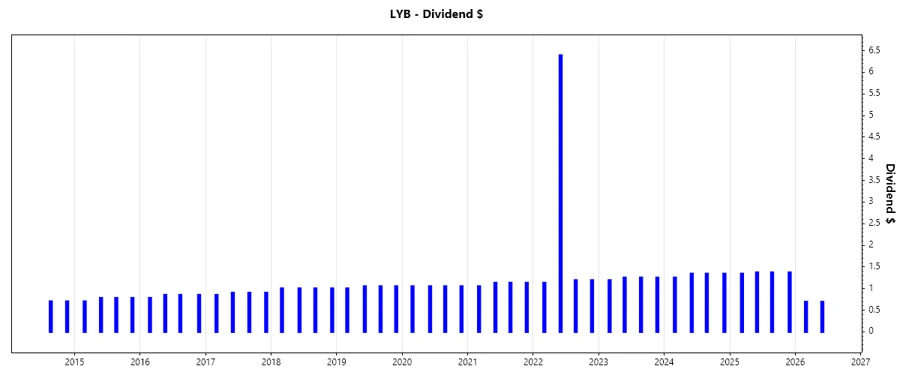
The consistency in LyondellBasell's dividend distribution reflects its commitment to stakeholder value, with minor fluctuations registering as part of broader strategic alignments. The dividend history underscores a resilient payout structure withstanding market variabilities.
| Year | Dividend Per Share (USD) |
|---|---|
| 2026 | 1.38 |
| 2025 | 5.45 |
| 2024 | 5.27 |
| 2023 | 4.94 |
| 2022 | 9.90 |
📈 Dividend Growth
An examination of the dividend growth metrics over three and five years reveals contrasting trends, suggesting modest appreciation challenges in recent periods. Leveraging growth metrics can suggest potential dividend trajectory shifts.
| Time | Growth |
|---|---|
| 3 years | -0.18% |
| 5 years | 5.35% |
The average dividend growth is 5.35% over 5 years. This shows moderate but steady dividend growth.
📉 Payout Ratio
With a high EPS-based payout ratio of -222.45%, LyondellBasell faces potential margin stress, whereas its 74.99% FCF-based payout ratio suggests marginal dividend sustainability. Evaluating these metrics helps understand payout sustainability risk.
| Key figure | Ratio |
|---|---|
| EPS-based | -222.45% |
| Free cash flow-based | 74.99% |
The EPS-based ratio highlights severe profitability issues, while the FCF-based ratio shows a more sustainable payout scenario.
🤑 Cashflow & Capital Efficiency
LyondellBasell's financial metrics suggest caution. Monitoring free cash flow yields and capex use is critical to assess capital allocation efficiency and ensure a strategic advantage in volatile markets.
| Year | 2025 | 2024 | 2023 |
|---|---|---|---|
| Free Cash Flow Yield | 2.75% | 8.20% | 11.04% |
| Earnings Yield | -5.33% | 5.63% | 6.84% |
| CAPEX to Operating Cash Flow | 83.02% | 48.15% | 30.98% |
| Stock-based Compensation to Revenue | 0.30% | 0.23% | 0.00% |
| Free Cash Flow / Operating Cash Flow Ratio | 16.98% | 51.85% | 69.02% |
Monitoring these cash flow measures provides insight into LyondellBasell's capacity for business reinvestment and operational resilience.
📊 Balance Sheet & Leverage Analysis
Key debt metrics and leverage ratios underline pressing challenges in managing obligations, necessitating vigilance regarding LyondellBasell's balance sheet strategy.
| Year | 2025 | 2024 | 2023 |
|---|---|---|---|
| Debt-to-Equity | 1.58 | 1.04 | 1.01 |
| Debt-to-Assets | 0.47 | 0.36 | 0.35 |
| Debt-to-Capital | 0.61 | 0.51 | 0.50 |
| Net Debt to EBITDA | 10.56 | 2.65 | 2.07 |
| Current Ratio | 1.77 | 1.83 | 1.84 |
| Financial Leverage | 3.37 | 2.87 | 2.86 |
These figures suggest heightened leverage, raising questions about short to medium-term financial flexibility.
✅ Fundamental Strength & Profitability
LyondellBasell's negative profitability indicators convey issues with margin maintenance. Evaluating multifaceted performance helps forecast potential operational improvements or further depreciation.
| Year | 2025 | 2024 | 2023 |
|---|---|---|---|
| Return on Equity | -7.37% | 10.91% | 16.35% |
| Return on Assets | -2.19% | 3.80% | 5.71% |
| Net Margin | -2.46% | 3.37% | 5.14% |
| Gross Margin | 9.00% | 11.32% | 12.79% |
| EBIT Margin | -0.68% | 5.17% | 7.55% |
| Research & Development to Revenue | 0.47% | 0.33% | 0.32% |
The decline in fundamental strength requires proactive management action to bolster long-term growth prospects.
💹 Price Development
🔍 Dividend Scoring System
| Category | Score | Rating |
|---|---|---|
| Dividend Yield | 4 | |
| Dividend Stability | 3 | |
| Dividend Growth | 2 | |
| Payout Ratio | 2 | |
| Financial Stability | 2 | |
| Dividend Continuity | 3 | |
| Cashflow Coverage | 2 | |
| Balance Sheet Quality | 1 |
Total Score: 19/40
🏅 Rating
Given the analyzed metrics, LyondellBasell Industries N.V. shows a concerning outlook due to its inconsistent cash flow and high leverage. While the dividend yield remains attractive, the overarching financial sustainability issues necessitate cautious consideration from investors.
Smart Data Insight
Master the Perfect Entry & Exit for this Stock
Don't leave your profits to chance. Historically, this stock follows specific seasonal patterns that institutional traders use to maximize returns.
- ✅ Identify the "Golden Buying Window"
- ✅ Avoid high-risk correction cycles
- ✅ Backtested data from the last 20+ years