October 20, 2025 a 02:46 am
LYB: Dividend Analysis - LyondellBasell Industries N.V.
LyondellBasell Industries N.V. offers investors a robust dividend profile marked by a substantial yield of 9.5%. Despite this high yield, the high payout ratio indicates potential risks if earnings do not improve. The company's 15-year dividend track record reflects a commitment to return capital to shareholders.
📊 Overview
The following table provides a snapshot of LyondellBasell's key dividend metrics:
| Metric | Value |
|---|---|
| Sector | Chemical Manufacturing |
| Dividend Yield | 9.5 % |
| Current Dividend Per Share | 5.29 USD |
| Dividend History | 15 years |
| Last Cut or Suspension | None |
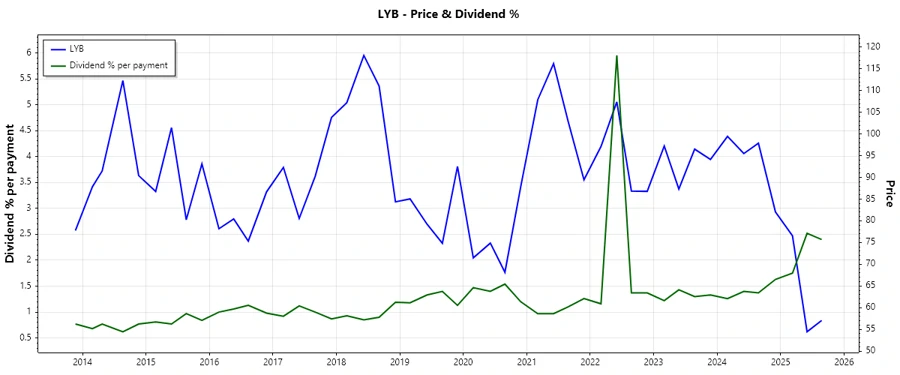
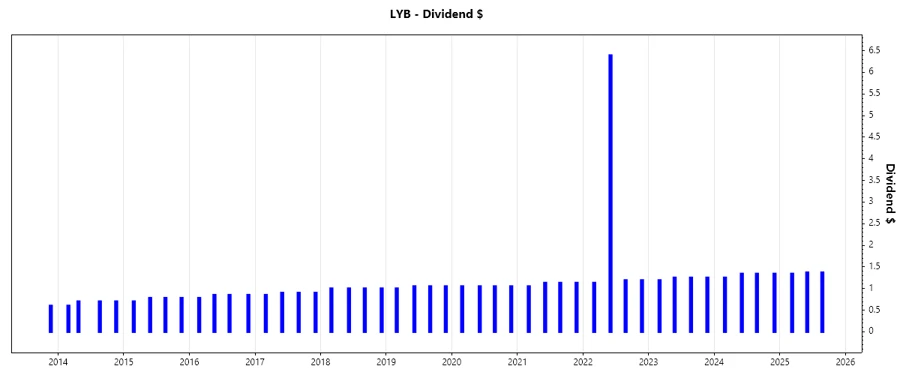
📈 Dividend History
The dividend history of LyondellBasell provides insights into its consistency in returning value to shareholders. The ability to maintain dividend payments is crucial for income-focused investors, especially with a history of 15 continuous years.
| Year | Dividend Per Share (USD) |
|---|---|
| 2021 | 4.44 |
| 2022 | 9.90 |
| 2023 | 4.94 |
| 2024 | 5.27 |
| 2025 | 4.08 |
📉 Dividend Growth
A pattern of dividend growth is indicative of increasing financial health and a commitment to shareholder value. Here’s a look at the growth metrics.
| Time | Growth |
|---|---|
| 3 years | 5.88 % |
| 5 years | 4.89 % |
The average dividend growth is 4.89 % over 5 years. This shows moderate but steady dividend growth.
✅ Payout Ratio
Payout ratios indicate how comfortably a company can support its dividends with profits and cash flow. A lower ratio is generally preferable.
| Key Figure | Ratio |
|---|---|
| EPS-based | 652.92 % |
| Free cash flow-based | 367.66 % |
A payout ratio of 652.92% (EPS) and 367.66% (FCF) suggests that the dividend payments currently exceed the company's earnings and cash flow capabilities, indicating a risky dividend policy.
💼 Cashflow & Capital Efficiency
Assessing cash flow and capital efficiency provides important insights into the ongoing financial health and strategic allocation of resources.
🔍 Balance Sheet & Leverage Analysis
A strong balance sheet with manageable leverage is key for long-term stability and operational flexibility.
🛠️ Fundamental Strength & Profitability
Strong fundamentals are the backbone of sustainable dividends and a company's profitability reflects its operational efficiency.
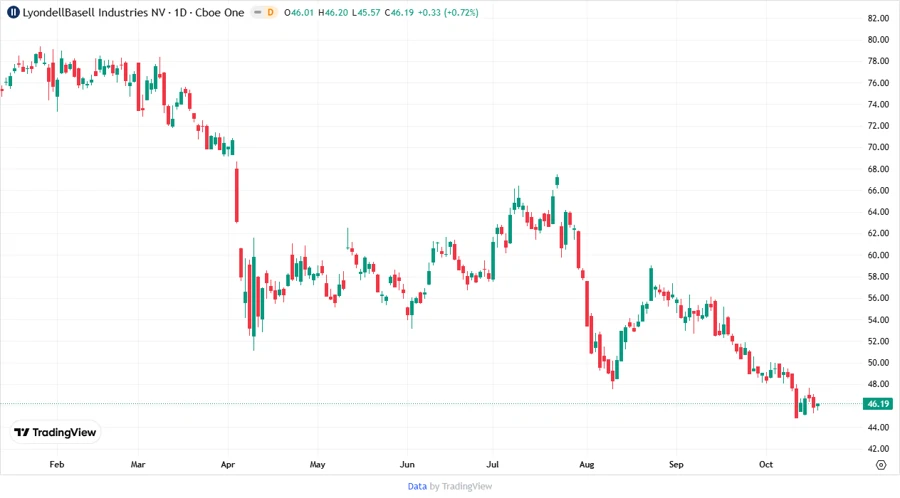
📊 Price Development
🏆 Dividend Scoring System
| Criterion | Description | Score |
|---|---|---|
| Dividend Yield | High | |
| Dividend Stability | Moderate | |
| Dividend Growth | Moderate | |
| Payout Ratio | High Risk | |
| Financial Stability | Moderate | |
| Dividend Continuity | Strong | |
| Cashflow Coverage | Weak | |
| Balance Sheet Quality | Stable |
Score: 37/40
🗣️ Rating
Despite its high dividend yield, LyondellBasell faces challenges with its payout ratio, making dividends less sustainable without improvements in earnings. Potential investors should weigh these aspects carefully. Overall, the company provides a compelling income opportunity, albeit with risks that are not insignificant.
Smart Data Insight
Master the Perfect Entry & Exit for this Stock
Don't leave your profits to chance. Historically, this stock follows specific seasonal patterns that institutional traders use to maximize returns.
- ✅ Identify the "Golden Buying Window"
- ✅ Avoid high-risk correction cycles
- ✅ Backtested data from the last 20+ years