November 12, 2025 a 09:03 am
LW: Trend and Support & Resistance Analysis - Lamb Weston Holdings, Inc.
Lamb Weston Holdings, Inc. shows resilience in the frozen food sector, evidenced by a recent moderate price increase. Monitoring recent trend indicators and support/resistance levels suggests cautious optimism. However, investors should be wary of potential volatility due to shifts in consumer demand and economic conditions.
Trend Analysis
| Date | Close Price | Trend |
|---|---|---|
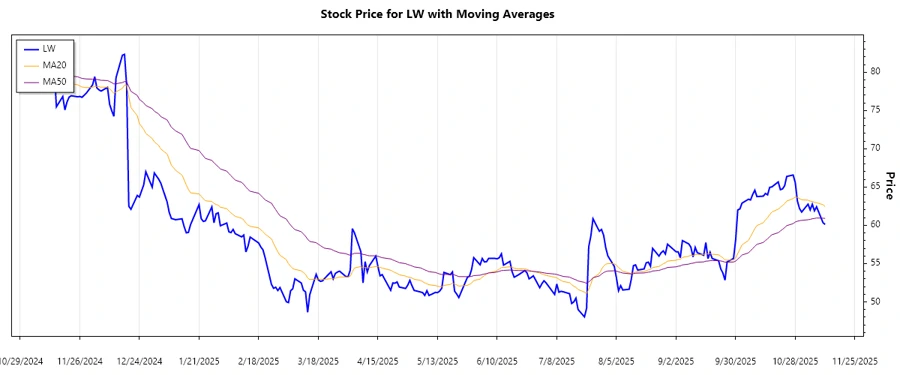
| 2025-11-11 | 60.10 | ▲ |
| 2025-11-10 | 60.36 | ⚖️ |
| 2025-11-07 | 62.42 | ▲ |
| 2025-11-06 | 61.89 | ▲ |
| 2025-11-05 | 62.76 | ▲ |
| 2025-11-04 | 62.01 | ▲ |
| 2025-11-03 | 62.76 | ▲ |
The current trend for Lamb Weston Holdings, Inc. appears bullish as the EMA20 significantly surpasses the EMA50. This indicates sustained upward momentum.
Support- and Resistance
| Zone Type | From | To |
|---|---|---|
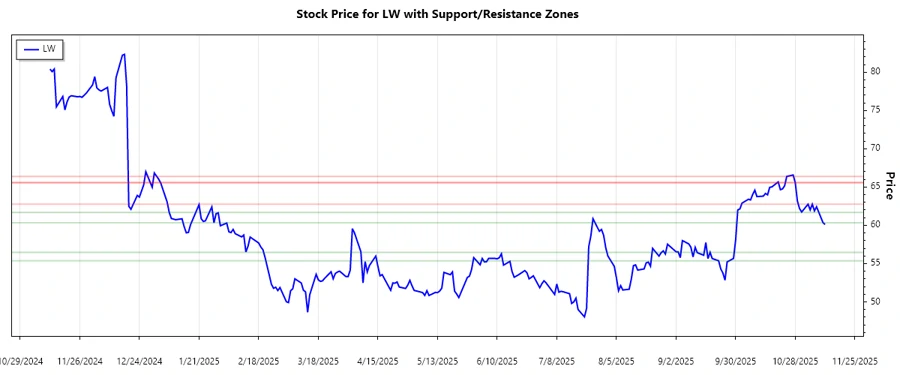
| Support Zone 1 | 55.37 | 56.47 |
| Support Zone 2 | 60.33 | 61.68 |
| Resistance Zone 1 | 65.57 | 66.38 |
| Resistance Zone 2 | 62.76 | 65.57 |
The current price trades within the higher support zone, suggesting strong foundational support at these levels. Crossing above 66 might signal further ascent.
Conclusion
Lamb Weston Holdings, Inc. is currently positioned in a rising trend channel with robust support areas protecting against potential downturns. As the market stands, positive outlooks amid steady consumer demand underscore potential gains. However, periodic evaluations are crucial, given economic fluctuations and supply chain challenges impacting the frozen food industry. For investors, this denotes both a promising opportunity and an alert to safeguard against unforeseen market variances.
Smart Data Insight
Master the Perfect Entry & Exit for this Stock
Don't leave your profits to chance. Historically, this stock follows specific seasonal patterns that institutional traders use to maximize returns.
- ✅ Identify the "Golden Buying Window"
- ✅ Avoid high-risk correction cycles
- ✅ Backtested data from the last 20+ years