September 20, 2025 a 01:15 pm

LW: Trend and Support & Resistance Analysis - Lamb Weston Holdings, Inc.
Lamb Weston Holdings, Inc., a leader in frozen potato products, has shown fluctuation in its stock price over the past months. By closely monitoring technical indicators, analysts aim to capture investment opportunities. The latest data indicates a potential trend direction which investors should closely examine as part of their decision-making process.
Trend Analysis
| Date | Close Price | Trend |
|---|---|---|
| 2025-09-19 | 55.66 | ▼ |
| 2025-09-18 | 56.47 | ▲ |
| 2025-09-17 | 55.65 | ▲ |
| 2025-09-16 | 57.74 | ▲ |
| 2025-09-15 | 56.09 | ▲ |
| 2025-09-12 | 56.42 | ▼ |
| 2025-09-11 | 57.12 | ▲ |
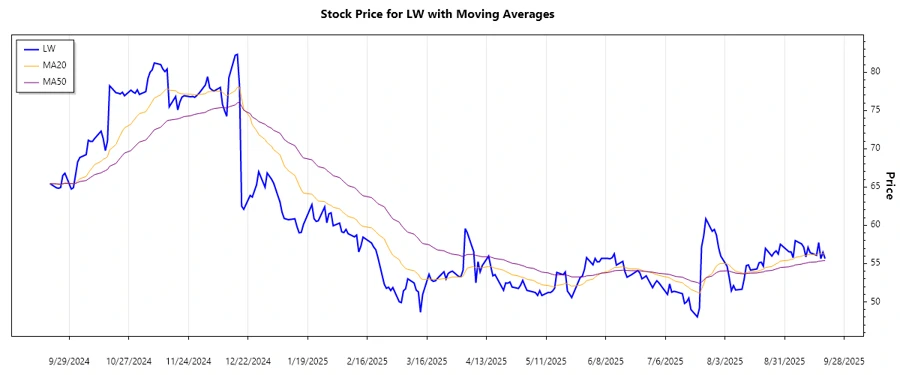
The EMA20 is above the EMA50, indicating a potential ▲ upward trend in recent data. This suggests positive momentum, although this should be confirmed with future price action.
Support and Resistance
| Zone Type | Zone Range |
|---|---|
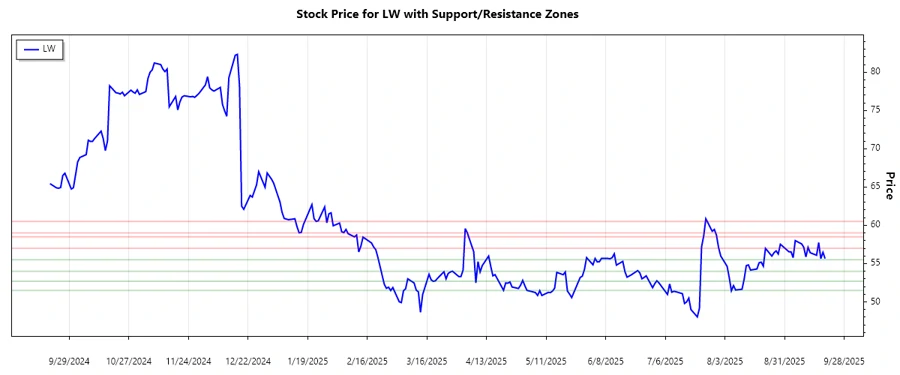
| Support Zone 1 | 51.50 - 52.70 ▲ |
| Support Zone 2 | 54.00 - 55.50 ▲ |
| Resistance Zone 1 | 57.00 - 58.50 ▼ |
| Resistance Zone 2 | 59.00 - 60.50 ▼ |
The latest closing price is testing the Support Zone 2, which may act as a strong base for upward movements. Should the price hold, this could validate a bullish outlook.
In conclusion, Lamb Weston's stock currently exhibits upward momentum with the potential for further gains if the price remains above key support levels. The presence of strong resistance zones could challenge upward progress, requiring caution for traders. Monitoring economic conditions, industry trends, and company performance is crucial to making informed investment decisions.
Smart Data Insight
Master the Perfect Entry & Exit for this Stock
Don't leave your profits to chance. Historically, this stock follows specific seasonal patterns that institutional traders use to maximize returns.
- ✅ Identify the "Golden Buying Window"
- ✅ Avoid high-risk correction cycles
- ✅ Backtested data from the last 20+ years