December 22, 2025 a 03:31 am
LW: Dividend Analysis - Lamb Weston Holdings, Inc.
Lamb Weston Holdings presents a compelling dividend profile highlighted by consistent payments over the years. Despite a recent pause in growth, the company maintains a competitive dividend yield within its sector. The stability of its payouts makes it an attractive option for income-focused investors seeking exposure in the food sector. However, attention should be paid to its payout ratio and leverage metrics. Overall, Lamb Weston showcases potential for long-term dividend sustainability.
📊 Overview
Lamb Weston stands as a significant player within the Consumer Staples sector, demonstrating a promising dividend yield of 3.39%. The company currently pays a dividend of $1.45 per share and boasts a robust dividend history of 10 years, albeit with a recent suspension projected for 2026.
| Attribute | Value |
|---|---|
| Sector | Consumer Staples |
| Dividend yield | 3.39 % |
| Current dividend per share | $1.45 USD |
| Dividend history | 10 years |
| Last cut or suspension | 2026 |
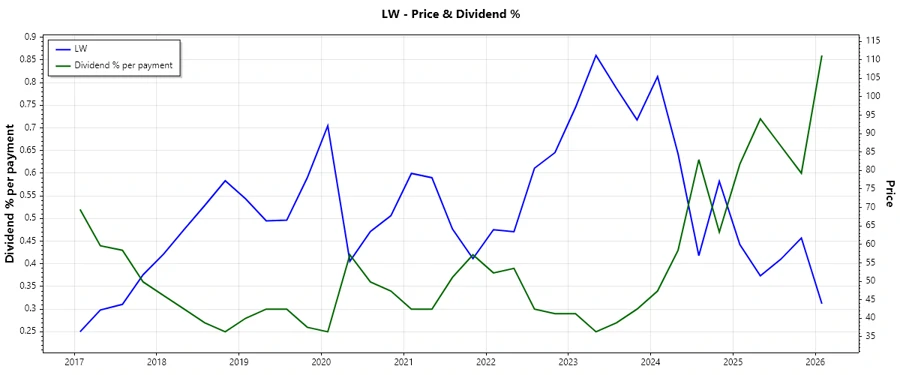
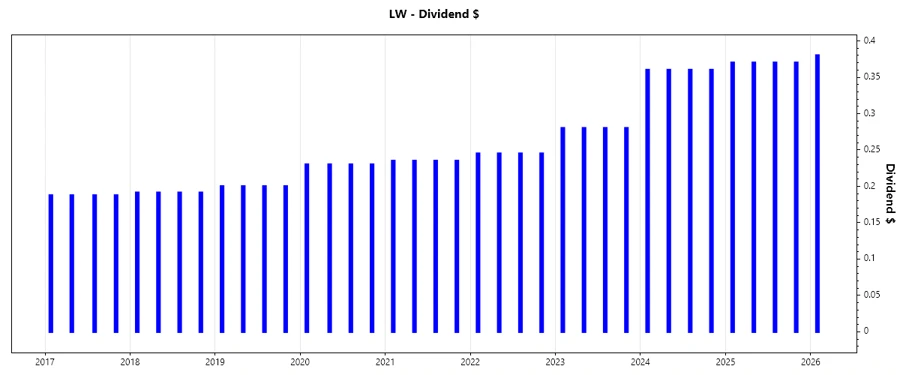
📉 Dividend History
The company's dividend history indicates steady payouts, affirming its commitment to returning value to shareholders. Such historical data is pivotal in assessing the firm's reliability and financial health, especially for investors prioritizing consistent income.
| Year | Dividend Per Share |
|---|---|
| 2026 | $0.38 |
| 2025 | $1.48 |
| 2024 | $1.44 |
| 2023 | $1.12 |
| 2022 | $0.98 |
📈 Dividend Growth
Analysis of dividend growth over the past few years reveals gradual intensification, with 3-year growth at approximately 0.15% and a 5-year progression of 0.12%. Such figures signify a stable yet modest growth trajectory, essential for gauging future potential.
| Time | Growth |
|---|---|
| 3 years | 15.28 % |
| 5 years | 12.47 % |
The average dividend growth is 12.47 % over 5 years. This shows moderate but steady dividend growth.
🗣️ Payout Ratio
The payout ratio is a critical metric that reflects the percentage of earnings distributed as dividends, which helps in understanding the sustainability of dividend payouts. Here, the EPS-based payout ratio stands at 51.70%, while the free cash flow-based figure is 40.54%.
| Key figure | Ratio |
|---|---|
| EPS-based | 51.70 % |
| Free cash flow-based | 40.54 % |
These ratios suggest a balanced approach to managing both earnings and free cash flows, underpinning dividend reliability.
🗣️ Cashflow & Capital Efficiency
The examination of cashflow metrics and capital efficiency provides insights into operational effectiveness and financial health. These indicators highlight the company’s capability to generate cash to fund dividends and drive growth.
| Key Metric | 2023 | 2024 | 2025 |
|---|---|---|---|
| Free Cash Flow Yield | 0.67 % | -1.03 % | 2.90 % |
| Earnings Yield | 6.28 % | 5.67 % | 4.50 % |
| CAPEX to Operating Cash Flow | 85.86 % | 116.45 % | 43.80 % |
| Stock-based Compensation to Revenue | 0.72 % | 0.72 % | 0.61 % |
| Free Cash Flow / Operating Cash Flow Ratio | 14.14 % | -16.45 % | 26.50 % |
Moderate capital efficiency and sustainable cash flow levels underscore the firm’s financial robustness and growth potential.
💳 Balance Sheet & Leverage Analysis
The strength of Lamb Weston’s balance sheet and its leverage levels are crucial for assessing risk and long-term sustainability. Key ratios such as Debt-to-Equity and the Current Ratio are indicators of financial leverage and liquidity.
| Key Metric | 2023 | 2024 | 2025 |
|---|---|---|---|
| Debt-to-Equity | 2.47 | 2.15 | 2.39 |
| Debt-to-Assets | 53.54 % | 52.30 % | 56.21 % |
| Debt-to-Capital | 71.21 % | 68.30 % | 70.51 % |
| Net Debt to EBITDA | 2.88 | 2.76 | 3.81 |
| Current Ratio | 1.56 | 1.29 | 1.38 |
| Quick Ratio | 0.88 | 0.59 | 0.68 |
| Financial Leverage | 4.62 | 4.12 | 4.25 |
These metrics emphasize a substantial but manageable level of leverage, suggesting a balanced financial profile conducive to enduring capital excellence.
🛠️ Fundamental Strength & Profitability
Assessing fundamental strength and profitability involves evaluating key metrics that drive operational efficiency, illustrating the firm’s capacity to sustain and enhance its market position.
| Key Metric | 2023 | 2024 | 2025 |
|---|---|---|---|
| Return on Equity | 71.49 % | 40.58 % | 20.56 % |
| Return on Assets | 15.47 % | 9.85 % | 4.83 % |
| Net Margin | 18.86 % | 11.22 % | 5.54 % |
| EBIT Margin | 16.49 % | 16.47 % | 10.31 % |
| EBITDA Margin | 20.65 % | 21.21 % | 16.63 % |
| Gross Margin | 26.77 % | 27.32 % | 21.68 % |
| R&D to Revenue | 0.00 % | 0.00 % | 0.00 % |
Solid profitability metrics reflect operational strength, highlighting Lamb Weston’s efficient utilization of resources and potential for sustained growth.
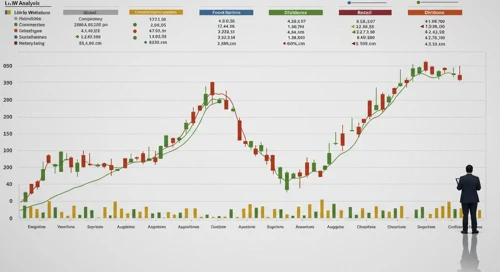
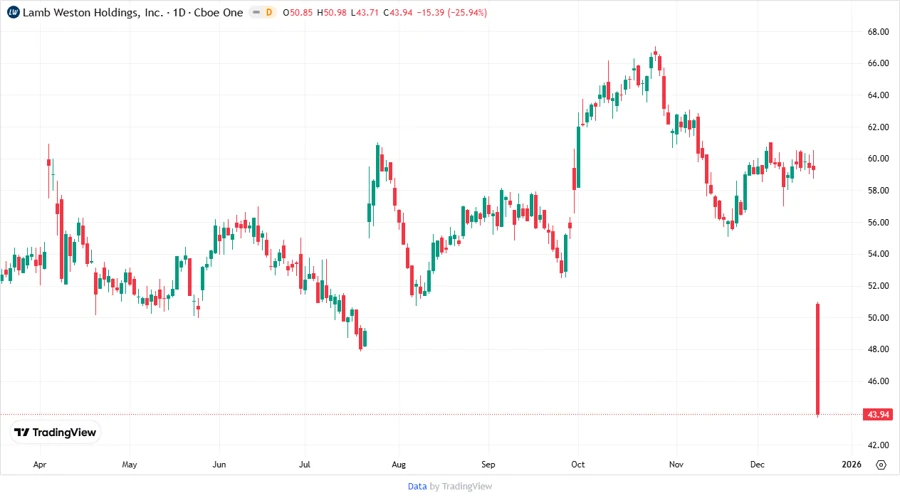
Price Development
✅ Dividend Scoring System
An in-depth analysis using a proprietary scoring framework evaluates key aspects influencing dividend reliability and growth potential.
| Criterion | Score (1-5) | Score Bar |
|---|---|---|
| Dividend yield | 4 | |
| Dividend Stability | 3 | |
| Dividend growth | 3 | |
| Payout ratio | 4 | |
| Financial stability | 4 | |
| Dividend continuity | 2 | |
| Cashflow Coverage | 4 | |
| Balance Sheet Quality | 3 |
Overall Score: 27/40
Rating
In conclusion, Lamb Weston Holdings' dividend profile demonstrates strength through a solid yield and manageable payout ratios. While recent interruptions in dividend growth pose a concern, its financial stability and operational efficiency support a favorable long-term outlook. Investors focused on income, with an appetite for potential growth amidst some risk, may find Lamb Weston a viable addition to their portfolio.