December 05, 2025 a 03:31 am


📊 Dividend Analysis - Lamb Weston Holdings, Inc.
Lamb Weston Holdings, Inc. (LW) has shown consistent dividend payouts over the years with a noteworthy dividend yield of approximately 2.40%. The company demonstrates moderate dividend growth and has maintained a stable payout ratio. Despite some financial fluctuations, LW remains a reliable choice for dividend-focused investors.
📈 Overview
Lamb Weston operates in the consumer staples sector, offering a steady dividend yield which appeals to long-term investors. The company's current dividend per share stands at $1.45, backed by a history of nine years of unbroken dividend payments. Interestingly, there have been no recent cuts or suspensions, illustrating a commitment to shareholder returns.
| Metric | Details |
|---|---|
| Sector | Consumer Staples |
| Dividend Yield | 2.40% |
| Current Dividend Per Share | 1.45 USD |
| Dividend History | 9 years |
| Last Cut or Suspension | None |
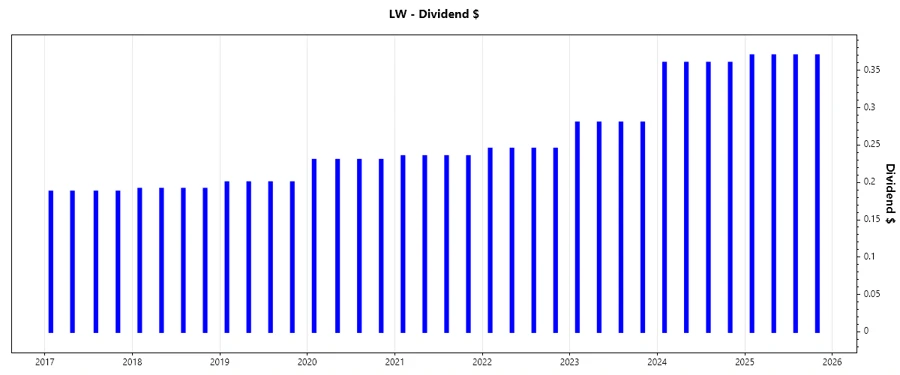
📉 Dividend History
Lamb Weston's dividend history reveals a pattern of consistent growth over the past years, evidencing the firm's dedication to rewarding its investors. Regular dividends not only signify a healthy financial position but also bolster investor confidence.
| Year | Dividend Per Share (USD) |
|---|---|
| 2025 | 1.48 |
| 2024 | 1.44 |
| 2023 | 1.12 |
| 2022 | 0.98 |
| 2021 | 0.94 |
📈 Dividend Growth
Analyzing the dividend growth rate, we observe a steady upward momentum in dividends over the recent years. This growth is pivotal for investors seeking yield enhancement over time.
| Time | Growth |
|---|---|
| 3 years | 15.28% |
| 5 years | 12.47% |
The average dividend growth is 12.47% over 5 years. This shows moderate but steady dividend growth.
✅ Payout Ratio
The payout ratio is crucial in evaluating a company's ability to sustain dividend payouts. Lamb Weston's EPS-based payout ratio stands at 69%, while the free cash flow-based payout ratio is 41%. These figures suggest that the company has a balanced approach to maintaining dividends without overly stretching financial resources.
| Key Figure | Ratio |
|---|---|
| EPS-based | 69.01% |
| Free Cash Flow-based | 40.54% |
The EPS payout ratio of 69.01% indicates a reasonable level of risk, suggesting ample coverage. Meanwhile, a lower FCF payout ratio at 40.54% underscores sustainable dividend payouts.
📊 Cashflow & Capital Efficiency
Free cash flow and capital efficiency metrics are significant indicators of a company's ability to finance its growth and reward shareholders sustainably. Analyzing these aspects offers great insight into Lamb Weston's financial health.
| Metric | 2025 | 2024 | 2023 |
|---|---|---|---|
| Free Cash Flow Yield | 0.029 | -0.010 | 0.0067 |
| Earnings Yield | 0.045 | 0.057 | 0.063 |
| CAPEX to Operating Cash Flow | 0.735 | 1.164 | 0.859 |
| Stock-based Compensation to Revenue | 0.006 | 0.007 | 0.007 |
| Free Cash Flow / Operating Cash Flow Ratio | 0.265 | -0.164 | 0.141 |
Despite some volatility in free cash flow yield, Lamb Weston showcases effective capital deployment, balancing CAPEX and operational efficiencies which is positive for long-term growth potential.
🗣️ Balance Sheet & Leverage Analysis
A deep dive into the balance sheet and leverage ratios provides a robust view of Lamb Weston's debt situation and its capacity to manage financial obligations.
| Metric | 2025 | 2024 | 2023 |
|---|---|---|---|
| Debt-to-Equity | 2.391 | 2.155 | 2.473 |
| Debt-to-Assets | 0.562 | 0.523 | 0.535 |
| Debt-to-Capital | 0.705 | 0.683 | 0.712 |
| Net Debt to EBITDA | 3.806 | 2.756 | 2.883 |
| Current Ratio | 1.377 | 1.287 | 1.564 |
| Quick Ratio | 0.676 | 0.586 | 0.879 |
| Financial Leverage | 4.254 | 4.121 | 4.620 |
Lamb Weston’s debt-related ratios are relatively high, suggesting leverage risks, yet the company holds a solid current ratio, indicating adequate liquidity to meet short-term liabilities.
📈 Fundamental Strength & Profitability
Investigating profitability and core strengths equips investors with a clear sight on Lamb Weston's capacity to generate returns effectively.
| Metric | 2025 | 2024 | 2023 |
|---|---|---|---|
| Return on Equity | 0.206 | 0.406 | 0.715 |
| Return on Assets | 0.048 | 0.098 | 0.155 |
| Margins: Net | 0.055 | 0.112 | 0.189 |
| EBIT | 0.103 | 0.165 | 0.165 |
| EBITDA | 0.166 | 0.212 | 0.207 |
| Gross | 0.212 | 0.273 | 0.268 |
| Research & Development to Revenue | 0.0034 | 0.0041 | 0.0032 |
The robust margins and return figures reflect Lamb Weston’s operational efficiency and ability to capitalize on its market position, despite a modest R&D spending format.
📊 Price Development
🗣️ Dividend Scoring System
| Criterion | Score | Score Bar |
|---|---|---|
| Dividend Yield | 4 | |
| Dividend Stability | 5 | |
| Dividend Growth | 3 | |
| Payout Ratio | 3 | |
| Financial Stability | 3 | |
| Dividend Continuity | 5 | |
| Cashflow Coverage | 4 | |
| Balance Sheet Quality | 3 |
Total Score: 30/40
📉 Rating
Lamb Weston Holdings, Inc. presents a stable option for dividend-seeking investors despite some leverage concerns. With consistent dividend yields and growth over time, the stock is recommended for cautious investors aiming to diversify their income portfolios with consumer staples. The present dividend yield and payout ratios underscore a mid-tier admirable financial strength, suggesting it should weather temporal market volatility effectively.