May 24, 2026 a 11:43 am

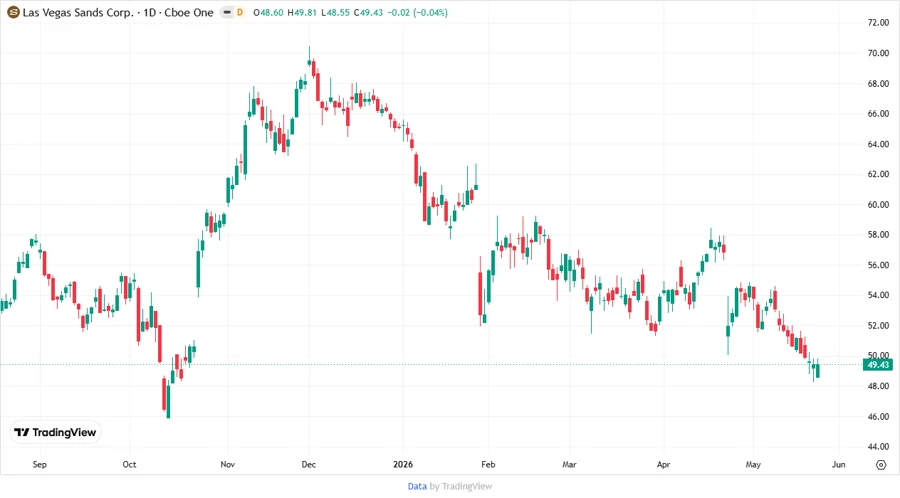
LVS: Fundamental Ratio Analysis - Las Vegas Sands Corp.
Las Vegas Sands Corp. holds a prominent position in the resort and casino industry with operations in Asia and the U.S. Despite challenges in the gambling sector, it consistently showcases strong potential. This analysis delves into its fundamental aspects to offer insights into its future performance.
Fundamental Rating
Las Vegas Sands has demonstrated moderate financial health with room for improvement in some areas. Its ROE and ROA are strong indicators of profitability, even as DCF and debt metrics need attention.
| Category | Score | Visualization |
|---|---|---|
| Discounted Cash Flow | 1 | |
| Return on Equity | 5 | |
| Return on Assets | 5 | |
| Debt to Equity | 1 | |
| Price to Earnings | 2 | |
| Price to Book | 1 |
Historical Rating
Historical data suggests stability in the company’s scores with consistent performance in most categories.
| Date | Overall | DCF | ROE | ROA | D/E | P/E | P/B |
|---|---|---|---|---|---|---|---|
| 2026-05-22 | 3 | 1 | 5 | 5 | 1 | 2 | 1 |
| Historical Date Placeholder | 0 | 1 | 5 | 5 | 1 | 2 | 1 |
Analyst Price Targets
The stock's price target shows optimistic growth, with a consensus leaning on further appreciation backed mainly by strong buy ratings.
| High | Low | Median | Consensus |
|---|---|---|---|
| $80 | $63 | $68.5 | $69.7 |
Analyst Sentiment
Most analysts favor the company, with the majority recommending a buy. This sentiment reflects confidence in the company’s strategic direction.
| Recommendation | Count | Distribution |
|---|---|---|
| Strong Buy | 0 | |
| Buy | 30 | |
| Hold | 19 | |
| Sell | 0 | |
| Strong Sell | 0 |
Conclusion
Las Vegas Sands Corp. presents a mixed but promising outlook. Its strong market presence and high ROE and ROA highlight profitability potential. Despite certain financial constraints such as high debt levels, analyst confidence remains robust with buy recommendations prevalent. However, challenges in the macroenvironment and a need for improved cash flow considerations should be regarded as potential risks.
Smart Data Insight
Master the Perfect Entry & Exit for this Stock
Don't leave your profits to chance. Historically, this stock follows specific seasonal patterns that institutional traders use to maximize returns.
- ✅ Identify the "Golden Buying Window"
- ✅ Avoid high-risk correction cycles
- ✅ Backtested data from the last 20+ years