December 02, 2025 a 05:15 am

LVS: Fibonacci Analysis - Las Vegas Sands Corp.
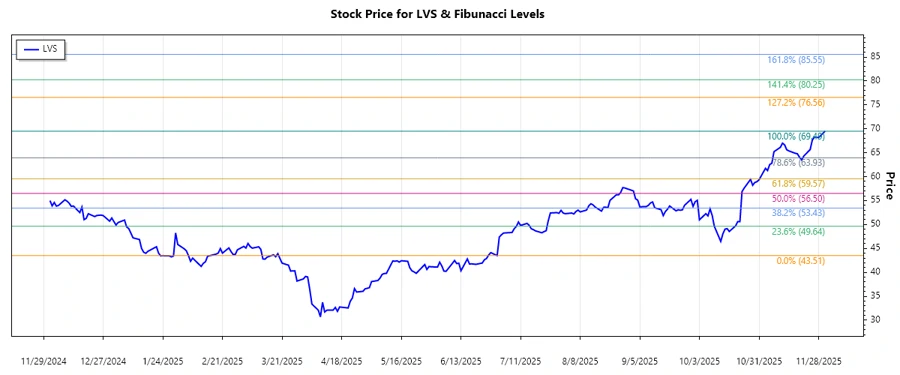
Las Vegas Sands Corp. (Ticker: LVS) has recently shown a significant upward trend in its stock price. This suggests a robust performance influenced by its expansive operations in the lucrative Asian and US markets. With a focus on integrated resorts, Las Vegas Sands Corp. has managed to rebound and gain investor confidence. This analysis provides insights into the technical levels and potential price zones based on Fibonacci retracement.
Fibonacci Analysis
| Attribute | Details |
|---|---|
| Start of Trend | 2025-06-30 |
| End of Trend | 2025-12-01 |
| High Price | $69.49 (2025-12-01) |
| Low Price | $43.51 (2025-06-30) |
| Fibonacci Level | Price Level |
|---|---|
| 0.236 | $53.35 |
| 0.382 | $57.02 |
| 0.5 | $58.59 |
| 0.618 | $60.16 |
| 0.786 | $63.12 |
The current stock price is within the 0.786 retracement zone, indicating a possible consolidation or resistance level near $63.12.
This level could serve as significant resistance, where the price might face sellers before a continued upward movement.
Conclusion
The strong upward trend in Las Vegas Sands Corp.'s stock highlights a return to optimistic investor sentiment. The company's strategic location in key markets such as Asia and the US suggests potential for future growth. However, current prices reaching the 0.786 Fibonacci retracement level could pose short-term barriers as investors evaluate the stock’s next move. A breakthrough at this level might confirm stronger momentum, while failure could lead to a minor correction. Analysts should watch these levels closely to capitalize on potential trading opportunities.
Smart Data Insight
Master the Perfect Entry & Exit for this Stock
Don't leave your profits to chance. Historically, this stock follows specific seasonal patterns that institutional traders use to maximize returns.
- ✅ Identify the "Golden Buying Window"
- ✅ Avoid high-risk correction cycles
- ✅ Backtested data from the last 20+ years