
July 12, 2026 a 03:31 pm

LVS: Dividend Analysis - Las Vegas Sands Corp.
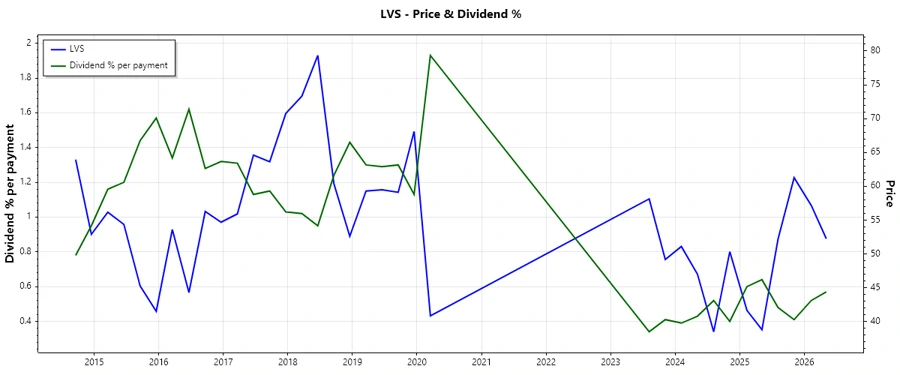
Las Vegas Sands Corp. demonstrates a manageable dividend profile with a reasonable yield of 2.10%. The company shows consistent dividend payouts over the years, yet with moderate growth, reflecting stability in payments. Though the last dividend cut or suspension isn't recent, continuous vigilance on payout ratios is advisable to ensure sustainable returns for investors.
Overview 📊
The overview highlights the dividends infrastructure. Las Vegas Sands Corp. operates within the gaming and hospitality sector, offering a dividend yield of 2.10%. The current dividend payout is at $1.21 per share, maintaining a 13-year history of distributions, which demonstrates commitment to returning value to shareholders.
| Key Metrics | Value |
|---|---|
| Sector | Gaming and Hospitality |
| Dividend Yield | 2.10 % |
| Current Dividend per Share | 1.21 USD |
| Dividend History | 13 years |
| Last Cut or Suspension | None |
Dividend History 📉
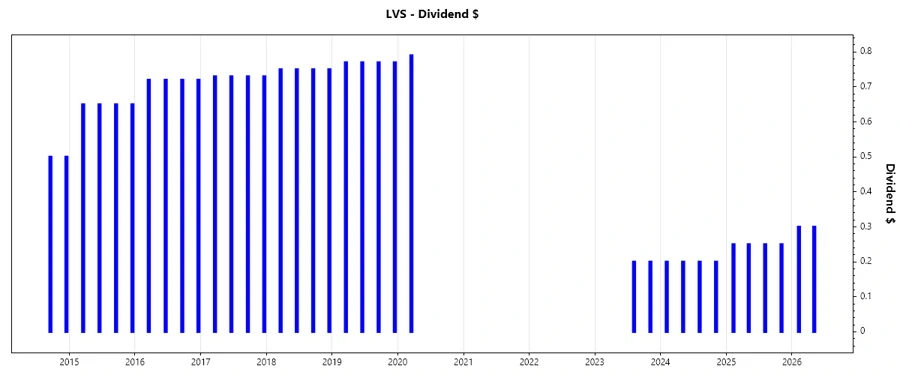
The history of dividends paid is crucial, reflecting the company's financial health and reliability in rewarding shareholders. Las Vegas Sands has sustained its dividend payments with minimal cuts, framing an investor-friendly track record.
| Year | Dividend per Share (USD) |
|---|---|
| 2026 | 0.6 |
| 2025 | 1.00 |
| 2024 | 0.8 |
| 2023 | 0.4 |
| 2020 | 0.79 |
Dividend Growth 📈
Tracking dividend growth provides insights into a firm's capacity to increase shareholder value over time. The growth rate over 3 and 5 years reflects Las Vegas Sands' strategic reinvestment in shareholder returns, indicating moderate growth potential.
| Time | Growth |
|---|---|
| 3 years | 8.17 % |
| 5 years | 4.83 % |
The average dividend growth is 4.83% over 5 years. This shows moderate but steady dividend growth.
Payout Ratio ⚠️
The payout ratio measures the sustainability of dividends in the context of earnings. With an EPS-based payout ratio of 43.78% and a FCF-based ratio of 34.43%, Las Vegas Sands demonstrates an adequate balance between rewarding investors and retaining earnings for growth.
| Key Figure | Ratio |
|---|---|
| EPS-based | 43.78 % |
| Free Cash Flow-based | 34.43 % |
These ratios indicate a diligent approach to maintaining dividend payments without overextending earnings capacity.
Cashflow & Capital Efficiency ✅
Effective capital management is illustrated in cash flow yields and CAPEX allocation. The operational efficiency metrics underscore Las Vegas Sands' adeptness in utilizing its cash flow to support both growth and dividends.
| Metric | 2025 | 2024 | 2023 |
|---|---|---|---|
| Free Cash Flow Yield | 7.50 % | 4.30 % | 5.25 % |
| Earnings Yield | 5.90 % | 3.83 % | 3.25 % |
| CAPEX to Operating Cash Flow | 28.13 % | 49.31 % | 38.95 % |
| Stock-based Compensation to Revenue | 0.49 % | 0.49 % | 0.42 % |
| Free Cash Flow / Operating Cash Flow Ratio | 58.88 % | 50.69 % | 61.05 % |
The findings reflect a stable cash flow underpinning capital return and growth objectives, supporting favorable reinvestments for sustained business development.
Balance Sheet & Leverage Analysis 📋
A solid balance sheet enhances a company's resilience against financial instability. For Las Vegas Sands, leverage indicators such as debt-to-equity ratios reveal substantial funding through debt, which could present challenges for interest coverage and liquidity metrics.
| Metric | 2025 | 2024 | 2023 |
|---|---|---|---|
| Debt-to-Equity | 10.15 | 4.77 | 3.41 |
| Debt-to-Assets | 73.62 % | 66.54 % | 64.42 % |
| Debt-to-Capital | 91.03 % | 82.66 % | 77.31 % |
| Net Debt to EBITDA | 2.59 | 2.49 | 2.31 |
| Current Ratio | 1.14 | 0.74 | 1.31 |
| Quick Ratio | 1.13 | 0.73 | 1.30 |
| Financial Leverage | 13.79 | 7.17 | 5.29 |
Las Vegas Sands exhibits high leverage, necessitating continued monitoring on debt servicing capabilities and liquidity maintenance for long-term financial health.
Fundamental Strength & Profitability 📊
Return metrics and profitability margins offer insights into operational efficiency and return pathways for investors. Las Vegas Sands' profitability indices reflect their ability to generate profits relative to costs, supporting continued growth and development of distribution capabilities.
| Metric | 2025 | 2024 | 2023 |
|---|---|---|---|
| Return on Equity | 102.33 % | 50.14 % | 29.65 % |
| Return on Assets | 7.42 % | 7.00 % | 5.61 % |
| Margins: Net | 12.50 % | 12.80 % | 11.77 % |
| Margins: EBIT | 22.73 % | 23.78 % | 25.00 % |
| Margins: EBITDA | 34.56 % | 35.89 % | 37.21 % |
| Margins: Gross | 49.79 % | 48.87 % | 49.82 % |
| Research & Development to Revenue | 2.07 % | 2.02 % | 1.98 % |
Overall profitability indicates robust market position and strategic R&D investments, facilitating a pathway for continuous value creation.
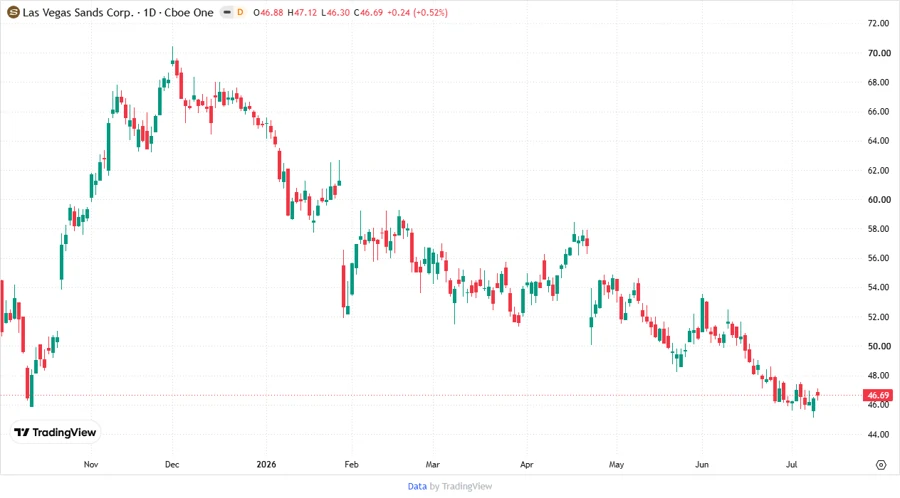
Price Development 🗒️
Dividend Scoring System ✅
| Criterion | Score | Score Bar |
|---|---|---|
| Dividend Yield | 3 | |
| Dividend Stability | 4 | |
| Dividend Growth | 3 | |
| Payout Ratio | 4 | |
| Financial Stability | 3 | |
| Dividend Continuity | 5 | |
| Cashflow Coverage | 4 | |
| Balance Sheet Quality | 3 |
Score: 29/40
Rating 🗣️
Las Vegas Sands Corp. holds a reliable dividend profile supported by adequate yields and moderate growth trends, suitable for income-focused investors. The company's financial strategies reinforce its ability to uphold dividend payments while ensuring growth through strategic investments, suggesting a firm 'Hold' position with cautious optimism on future performance.
Smart Data Insight
Master the Perfect Entry & Exit for this Stock
Don't leave your profits to chance. Historically, this stock follows specific seasonal patterns that institutional traders use to maximize returns.
- ✅ Identify the "Golden Buying Window"
- ✅ Avoid high-risk correction cycles
- ✅ Backtested data from the last 20+ years