November 16, 2025 a 12:46 pm

LVS: Dividend Analysis - Las Vegas Sands Corp.
Las Vegas Sands Corp. demonstrates a unique dividend profile characterized by its recent suspension in 2023 and a history of significant changes in dividend amount. While the current yield is moderate, the sustainability of future dividends is closely tied to the company's financial recovery post-2023 and its strategic financial management.
Overview 📊
Las Vegas Sands Corp., operating within the Leisure and Resort Sector, offers a dividend yield of 1.63% with a current dividend rate of $0.80 per share. With 12 years of dividend payments but recent instability in 2023, continuous monitoring is essential.
| Sector | Dividend Yield (%) | Current Dividend Per Share (USD) | Dividend History (Years) | Last Cut/Suspension |
|---|---|---|---|---|
| Leisure and Resort | 1.63% | 0.80 USD | 12 years | 2023 |
Dividend History 🗣️
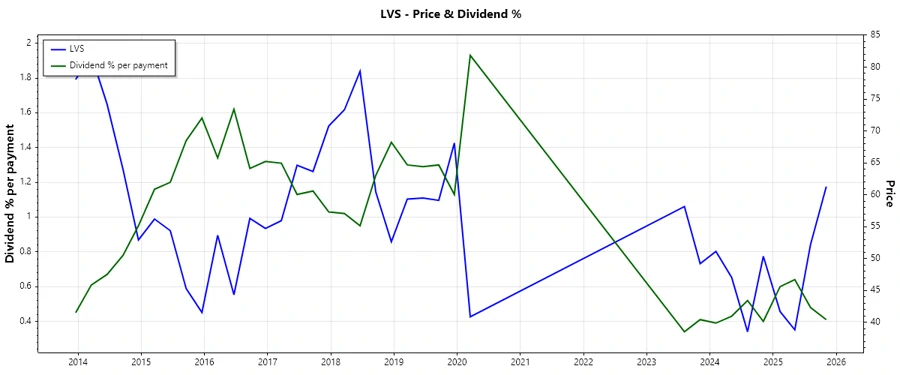
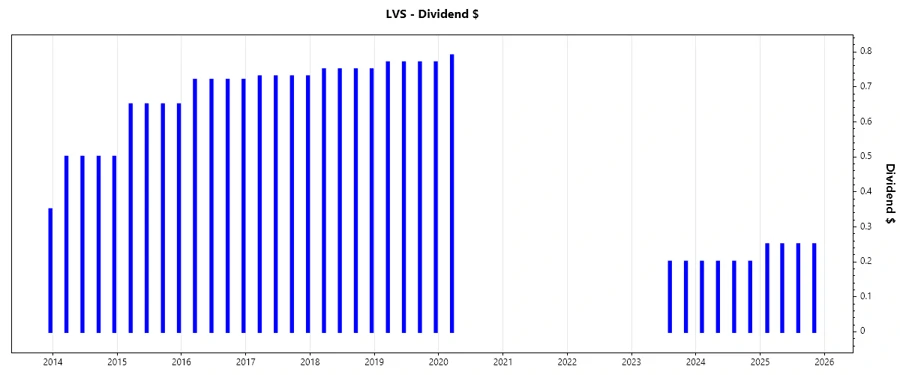
The historical dividend payments show a pattern of varied dividend sizes, crucial for investors evaluating the company's commitment to its shareholders. The impact of financial downturns in 2023 must be considered in future projections.
| Year | Dividend Per Share (USD) |
|---|---|
| 2025 | 1.00 |
| 2024 | 0.80 |
| 2023 | 0.40 |
| 2020 | 0.79 |
| 2019 | 3.08 |
Dividend Growth 📈
Understanding dividend growth is crucial for assessing the potential for income growth. The growth rate over three years is a nominal 0.42%, while over five years, it has decreased by 23.63%, highlighting significant past distribution adjustments.
| Time | Growth (%) |
|---|---|
| 3 years | 0.42% |
| 5 years | -23.63% |
The average dividend growth is -23.63% over 5 years. This shows moderate but steady dividend volatility.
Payout Ratio 💸
Examining payout ratios is essential to understanding how much of its earnings and cash flow a company returns to shareholders. LVS demonstrates a sensible EPS-based payout ratio of 35.18% and a higher free cash flow-based ratio of 42.07%, indicating reliance on cash flexibility to maintain payments.
| Key Figure | Ratio (%) |
|---|---|
| EPS-based | 35.18% |
| Free cash flow-based | 42.07% |
EPS and FCF payout ratios highlight an earnings-oriented but cash flow-reliant distribution approach, indicating prudent use of both metrics.
Cashflow & Capital Efficiency 💵
Core to financial sustainability, cash flow and capital efficiency metrics shed light on operational effectiveness. Trends in free cash flow yield, earnings yield, and capital expenditures dramatically influence shareholder returns.
| Indicator | 2022 | 2023 | 2024 |
|---|---|---|---|
| Free Cash Flow Yield | -4.29% | 5.25% | 4.30% |
| Earnings Yield | -2.78% | 3.25% | 3.83% |
| CAPEX to Operating Cash Flow | -98.11% | 38.95% | 49.31% |
| Stock-based Compensation to Revenue | 0.95% | 0.42% | 0.49% |
| Free Cash Flow / Operating Cash Flow | 198.11% | 61.05% | 50.69% |
The analysis indicates some volatility, especially in CAPEX to cash flows, suggesting strategic adjustments to sustainable investment levels may be beneficial.
Balance Sheet & Leverage Analysis 📊
Evaluating debt levels and financial leverage relative to shareholder equity puts into perspective the company’s financial resilience, indicated by the substantial influence debt holds over capital and equity.
| Metric | 2022 | 2023 | 2024 |
|---|---|---|---|
| Debt-to-Equity | 411.69% | 340.68% | 476.84% |
| Debt-to-Assets | 72.50% | 64.42% | 66.54% |
| Debt-to-Capital | 80.46% | 77.31% | 82.66% |
| Net Debt to EBITDA | 27.54 | 2.28 | 2.46 |
| Current Ratio | 1.73 | 1.31 | 0.74 |
| Quick Ratio | 1.72 | 1.30 | 0.73 |
| Financial Leverage | 5.68 | 5.29 | 7.17 |
High leverage ratios highlight significant financial risk exposure, yet suggest potential scaling benefits supporting solvency and operational needs.
Fundamental Strength & Profitability 📈
Profitability ratios affirm operational efficiency, whereas a detailed profitability analysis determines margin sustainability. The critical analysis aligns with the market expectations for margins and returns.
| Indicator | 2022 | 2023 | 2024 |
|---|---|---|---|
| Return on Equity | -26.28% | 29.65% | 50.14% |
| Return on Assets | -4.63% | 5.61% | 7.00% |
| Net Margin | -24.82% | 11.77% | 12.80% |
| EBIT Margin | -16.67% | 25.00% | 23.78% |
| EBITDA Margin | 8.54% | 37.79% | 36.40% |
| Gross Margin | 14.94% | 37.61% | 36.76% |
| R&D to Revenue | 0.00% | 0.00% | 0.00% |
Restored margins from 2023 forward emphasize a robust recovery from prior losses, demonstrating adaptability and potential growth under favorable conditions.
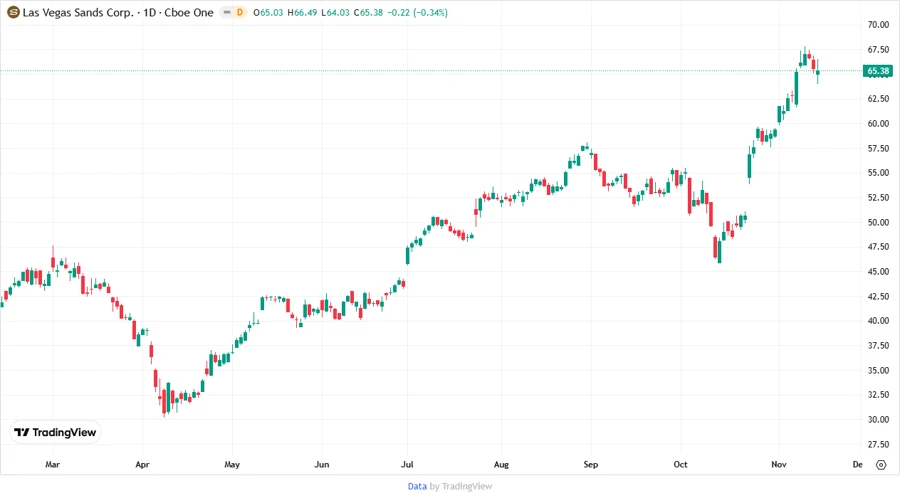
Price Development 📉
Dividend Scoring System ✅
| Category | Score | Score Indicator |
|---|---|---|
| Dividend Yield | 2/5 | |
| Dividend Stability | 3/5 | |
| Dividend Growth | 1/5 | |
| Payout Ratio | 4/5 | |
| Financial Stability | 3/5 | |
| Dividend Continuity | 1/5 | |
| Cashflow Coverage | 3/5 | |
| Balance Sheet Quality | 2/5 |
Total Score: 19/40
Rating ✔️
Las Vegas Sands Corp. currently presents a moderate dividend profile with notable risk factors, particularly in its growth prospects and stability. Given the high debt leverage and previous volatility in dividend payouts, cautious investment consideration is warranted. The stock may appeal to risk-tolerant investors with a focus on longer-term capital appreciation rather than immediate dividend income.
Smart Data Insight
Master the Perfect Entry & Exit for this Stock
Don't leave your profits to chance. Historically, this stock follows specific seasonal patterns that institutional traders use to maximize returns.
- ✅ Identify the "Golden Buying Window"
- ✅ Avoid high-risk correction cycles
- ✅ Backtested data from the last 20+ years