October 25, 2025 a 12:46 pm

LVS: Dividend Analysis - Las Vegas Sands Corp.
Las Vegas Sands Corp. presents a complex picture in the dividend landscape. The company has a modest dividend yield but faces challenges with dividend growth. Its payout ratios signal responsible management, yet concerns linger over its financial leverage. Comprehensive understanding of the financial metrics is critical for investment decisions.
Overview 📊
The following overview highlights key dividend metrics for Las Vegas Sands Corp., offering insight into its sector dynamics and dividend profile.
| Metric | Value |
|---|---|
| Sector | Consumer Discretionary |
| Dividend yield | 1.74% |
| Current dividend per share | 0.80 USD |
| Dividend history | 12 years |
| Last cut or suspension | 2023 |
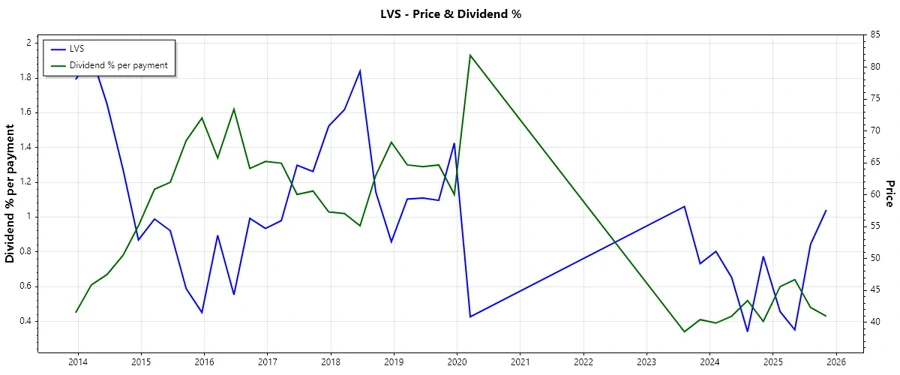
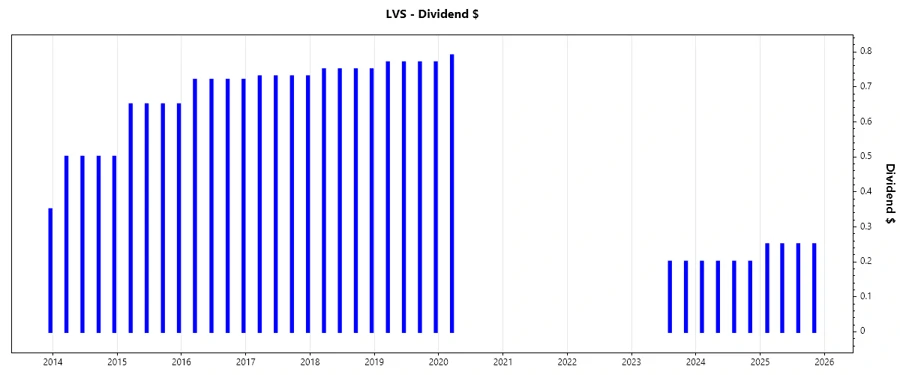
Dividend History 🗣️
Analyzing the dividend history offers a glance at Las Vegas Sands Corp.'s commitment to shareholder returns over the years.
| Year | Dividend per Share (USD) |
|---|---|
| 2025 | 1.00 |
| 2024 | 0.8 |
| 2023 | 0.4 |
| 2020 | 0.79 |
| 2019 | 3.08 |
Dividend Growth 📈
The growth of dividends over 3 and 5 years is essential to gauge sustainability and investor confidence in future payouts.
| Time | Growth |
|---|---|
| 3 years | 0.00% |
| 5 years | -23.63% |
The average dividend growth is -23.63% over 5 years. This shows volatility and potentially declining investor expectations.
Payout Ratio ✅
Payout ratios provide insight into how well earnings support dividend payments, crucial for assessing dividend sustainability.
| Key figure | Ratio |
|---|---|
| EPS-based | 35.18% |
| Free cash flow-based | 100.37% |
The EPS-based payout ratio is healthy at 35.18%, indicating potential for maintaining dividends. However, the FCF-based ratio of 100.37% suggests a potential strain on free cash flow.
Cashflow & Capital Efficiency 📉
Liabilities, operational efficiency, and capacity to generate cash flow are pivotal in evaluating financial health.
| Metric | 2022 | 2023 | 2024 |
|---|---|---|---|
| Free Cash Flow Yield | -4.29% | 5.25% | 4.30% |
| Earnings Yield | -2.78% | 3.25% | 3.83% |
| CAPEX to Operating Cash Flow | -98.11% | 38.95% | 49.31% |
| Stock-based Compensation to Revenue | 0.95% | 0.42% | 0.49% |
| Free Cash Flow / Operating Cash Flow Ratio | 198.11% | 61.05% | 50.69% |
The cash flow and capital efficiency metrics highlight fluctuations in cash generation capability and capital deployment efficiency.
Balance Sheet & Leverage Analysis 🏦
The balance sheet provides insights into the company's financial stability, liquidity position, and indebtedness.
| Metric | 2022 | 2023 | 2024 |
|---|---|---|---|
| Debt-to-Equity | 411.70% | 340.68% | 476.84% |
| Debt-to-Assets | 72.50% | 64.42% | 66.54% |
| Debt-to-Capital | 80.46% | 77.31% | 82.66% |
| Net Debt to EBITDA | 27.54 | 2.28 | 2.46 |
| Current Ratio | 1.73 | 1.31 | 0.74 |
| Quick Ratio | 1.72 | 1.30 | 0.73 |
| Financial Leverage | 5.68 | 5.29 | 7.17 |
The balance sheet analysis reveals high leverage and a mixed position in liquidity, essential for investors assessing risk exposure.
Fundamental Strength & Profitability ⚙️
Profitability indicators and R&D expenditure are vital in understanding operational efficiency and innovation capacity.
| Metric | 2022 | 2023 | 2024 |
|---|---|---|---|
| Return on Equity | -26.28% | 29.65% | 50.14% |
| Return on Assets | -4.63% | 5.61% | 7.00% |
| Net Margin | -24.82% | 11.77% | 12.80% |
| EBIT Margin | -16.67% | 25.00% | 23.78% |
| EBITDA Margin | 8.54% | 37.79% | 36.40% |
| Gross Margin | 14.94% | 37.61% | 36.76% |
| R&D to Revenue | 0.0% | 0.0% | 2.02% |
The fundamental metrics show a turnaround in profitability, with substantial improvements in ROE and net margins over the years.
Price Development 🏷️
Dividend Scoring System 🔍
| Criteria | Score | Score Bar |
|---|---|---|
| Dividend yield | 2 | |
| Dividend Stability | 3 | |
| Dividend growth | 2 | |
| Payout ratio | 3 | |
| Financial stability | 3 | |
| Dividend continuity | 2 | |
| Cashflow Coverage | 3 | |
| Balance Sheet Quality | 2 |
Total Score: 20/40
Rating 🌟
Las Vegas Sands Corp. presents a mixed dividend profile with low yields and recent cuts affecting growth prospects. The company displays reasonable financial health, but increased leverage poses a risk. Potential investors must carefully weigh the balance between risk and potential returns before investing.
Smart Data Insight
Master the Perfect Entry & Exit for this Stock
Don't leave your profits to chance. Historically, this stock follows specific seasonal patterns that institutional traders use to maximize returns.
- ✅ Identify the "Golden Buying Window"
- ✅ Avoid high-risk correction cycles
- ✅ Backtested data from the last 20+ years