November 26, 2025 a 03:15 am

LUV: Trend and Support & Resistance Analysis - Southwest Airlines Co.
Southwest Airlines' stock has shown significant volatility over the past months, reflecting the broader challenges faced by the airline industry. The current pricing reveals attempts to recover previous highs; however, ongoing market dynamics make the trend and support levels critical for investors. Overall, an analysis of the charts indicates a predominantly bearish trend with crucial support and resistance zones emerging. Investors should pay attention to these zones to make informed decisions.
Trend Analysis
By evaluating the recent closing prices of Southwest Airlines Co., we calculated the EMA20 and EMA50. The analysis indicates a ▼ bearish trend as the EMA20 remains below the EMA50. This suggests prevailing downward momentum, contradicting any short-term bullish signals that might appear.
| Date | Close Price | Trend |
|---|---|---|
| 2025-11-25 | 34.36 | ▼ |
| 2025-11-24 | 33.28 | ▼ |
| 2025-11-21 | 32.8 | ▼ |
| 2025-11-20 | 31.16 | ▼ |
| 2025-11-19 | 31.92 | ▼ |
| 2025-11-18 | 31.96 | ▼ |
| 2025-11-17 | 31.85 | ▼ |
The consistent downward trend indicates individual investors should proceed with caution, confirming that prices are more likely to continue declining unless significant positive market influences occur.
Support and Resistance
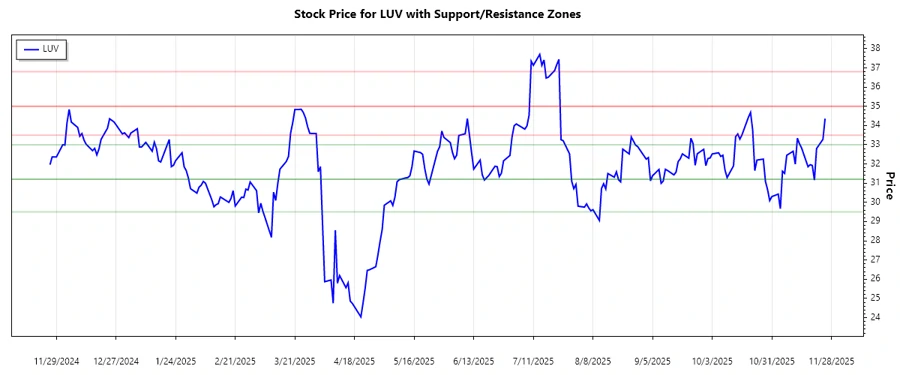
After analyzing the price data, the support levels are found around $29.5 and $31.2, while resistance stands at approximately $33.5 and $35.0. These levels are crucial in determining the stock's future price path.
| Zone Type | Zone Range | Indicator |
|---|---|---|
| Support | $29.5 - $31.2 | ▼ |
| Support | $31.2 - $33 | ▼ |
| Resistance | $33.5 - $35 | ▲ |
| Resistance | $35 - $36.8 | ▲ |
Currently, the stock is residing near the higher support zone, suggesting potential short-term stability, but it faces challenges in breaking through upper resistance levels. This emphasizes the importance of closely monitoring these thresholds.
Conclusion
Southwest Airlines Co's stock is in a precarious position, showing a bearish trend with possible short-term stability at its support zones. Investors should be cautious, as the stock has been struggling to breach crucial resistance thresholds. As market conditions evolve, any clear break through the resistance could signify a trend reversal. Nevertheless, failing to maintain current support levels may result in further declines. Prospective buyers and holders should remain observant of market cues and consider the inherent risks in their strategies.