January 25, 2026 a 05:15 am

LUV: Fibonacci Analysis - Southwest Airlines Co.
Southwest Airlines Co. has seen notable fluctuations in its stock price over the analyzed period. This analysis aims to provide insights into potential retracement levels, which could serve as key areas of support or resistance based on the recent trend. Understanding these levels can be crucial for traders looking to optimize entry and exit points in a highly competitive airline market.
Fibonacci Analysis
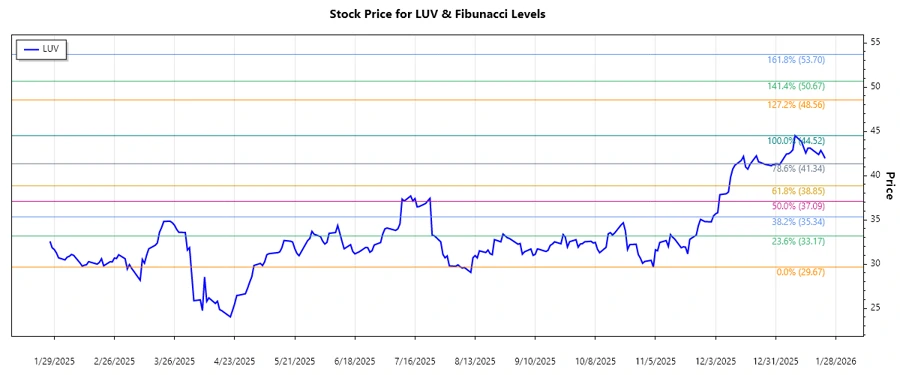
The trend under analysis covers a remarkable rise in Southwest Airlines' stock, marking a significant upward trajectory. Let us delve into the Fibonacci retracement levels, derived from the stock's highest and lowest points during this period.
| Details | Value |
|---|---|
| Trend Start Date | 2025-11-03 |
| Trend End Date | 2026-01-23 |
| High Point | $44.52 (2026-01-09) |
| Low Point | $29.67 (2025-11-04) |
| Fibonacci Levels |
|
| Current Price Position | The current price of $41.95 lies above the 0.618 retracement level. |
| Interpretation | The current price position near the 0.786 level indicates a strong resistance area but also potential support from the previous peak during pullbacks. |
Conclusion
The observed trend in Southwest Airlines Co.'s stock demonstrates a strong upward movement, indicating investor confidence. The Fibonacci retracement levels offer clear insights, with the current price nearing a significant support/resistance zone. Traders may consider cautious approaches at these levels due to potential volatility. Overall, while there are prospective opportunities for gains, risks related to broader market conditions and airline-specific challenges remain critical factors for consideration.