
July 12, 2026 a 12:46 pm
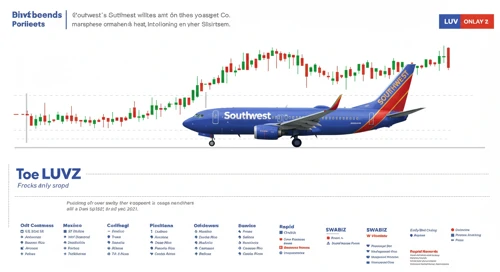


LUV: Dividend Analysis - Southwest Airlines Co.
Southwest Airlines Co. has been a steady player in the aviation industry, known for its resilient financial practice. The company's dividend profile presents a dual perspective. On one hand, it showcases a robust 45-year history of dividend payments. On the other hand, it demonstrates mild dividend growth and variability in cash flows. Investors should assess the sustainability of current dividends alongside potential risks arising from the payout ratios.
📊 Overview
Southwest Airlines Co. is situated in a challenging sector, heavily influenced by economic cycles. Despite this, the company maintains a decent dividend yield and a substantial history of dividend payments.
| Metric | Details |
|---|---|
| Sector | Airline |
| Dividend yield | 1.63 % |
| Current dividend per share | 0.74 USD |
| Dividend history | 45 years |
| Last cut or suspension | None |
🗣️ Dividend History
Maintaining a 45-year continuous dividend payout is rare, particularly in a sector prone to economic variables. This demonstrates financial resilience and commitment to returning value to shareholders.
| Year | Dividend per Share (USD) |
|---|---|
| 2026 | 0.36 |
| 2025 | 0.72 |
| 2024 | 0.72 |
| 2023 | 0.90 |
| 2020 | 0.18 |
📈 Dividend Growth
The assessment of dividend growth is essential for understanding potential future income from investments. Steady growth implies stability and managerial foresight.
| Time | Growth |
|---|---|
| 3 years | 0.59 % |
| 5 years | 0.32 % |
The average dividend growth is 0.32 % over 5 years. This shows moderate but steady dividend growth.
📉 Payout Ratio
The payout ratio informs on the portion of earnings and free cash flow allocated to dividends. A balanced ratio indicates sustainable dividend practices.
| Key figure | Ratio |
|---|---|
| EPS-based | 45.04 % |
| Free cash flow-based | -90.06 % |
The EPS payout ratio is reasonable, indicating dividends are well-covered by current earnings. However, the negative free cash flow payout ratio signals potential cash flow issues, raising concerns over future dividend sustainability.
⚠️ Cashflow & Capital Efficiency
Understanding cash flow efficiency and capital allocation is critical for assessing a company's ability to sustain operations and shareholder returns.
| Metric | 2025 | 2024 | 2023 |
|---|---|---|---|
| Free Cash Flow Yield | -3.72 % | -8.05 % | -2.07 % |
| Earnings Yield | 1.98 % | 2.31 % | 2.71 % |
| CAPEX to Operating Cash Flow | 145.11 % | 450.21 % | 111.25 % |
| Stock-based Compensation to Revenue | 0% | 0% | 0% |
| Free Cash Flow / Operating Cash Flow Ratio | -45.11 % | -350.21 % | -11.25 % |
With free cash flow yields in the negative, this elucidates a challenging cash flow condition, impacting the ability to cover dividends and capital expenses sufficiently.
✅ Balance Sheet & Leverage Analysis
A robust balance sheet and adept leverage management are foundational to a company's financial strength and operational flexibility.
| Metric | 2025 | 2024 | 2023 |
|---|---|---|---|
| Debt-to-Equity | 0.75 | 0.78 | 0.87 |
| Debt-to-Assets | 0.21 | 0.24 | 0.25 |
| Debt-to-Capital | 0.43 | 0.44 | 0.47 |
| Net Debt to EBITDA | 1.29 | 0.22 | -0.04 |
| Current Ratio | 0.52 | 0.92 | 1.14 |
| Quick Ratio | 0.45 | 0.85 | 1.07 |
| Financial Leverage | 3.64 | 3.26 | 3.47 |
The leverage ratios are within acceptable limits, supporting operational stability. However, tightening liquidity ratios demand cautious cash flow management to avoid solvency risks.
📊 Fundamental Strength & Profitability
Profitability and efficient use of assets are critical markers of a company's financial health in delivering shareholder value.
| Metric | 2025 | 2024 | 2023 |
|---|---|---|---|
| Return on Equity | 5.53 % | 4.49 % | 4.42 % |
| Return on Assets | 1.52 % | 1.38 % | 1.27 % |
| Margins: Net | 1.57 % | 1.69 % | 1.78 % |
| Margins: EBIT | 2.41 % | 2.95 % | 3.33 % |
| Margins: EBITDA | 7.97 % | 8.98 % | 9.16 % |
| Margins: Gross | 17.44 % | 16.22 % | 16.19 % |
| Research & Development to Revenue | 0% | 0% | 0% |
Positive profitability measures indicate operational efficiency. However, the absence of R&D investment may hint at limited innovation potential, raising questions on future competitive positioning.
📈 Price Development
🔍 Dividend Scoring System
| Criterion | Score | Bar |
|---|---|---|
| Dividend Yield | 3/5 | |
| Dividend Stability | 5/5 | |
| Dividend Growth | 2/5 | |
| Payout Ratio | 2/5 | |
| Financial Stability | 3/5 | |
| Dividend Continuity | 5/5 | |
| Cashflow Coverage | 1/5 | |
| Balance Sheet Quality | 3/5 |
Total Score: 24/40
🏆 Rating
Southwest Airlines Co. demonstrates significant dividend continuity, but it is marred by low growth and critical cash flow challenges. While current dividends are stable, interested investors are advised to consider potential impacts from operational liquidity and leverage, making LUV a moderate-risk dividend stock.
Smart Data Insight
Master the Perfect Entry & Exit for this Stock
Don't leave your profits to chance. Historically, this stock follows specific seasonal patterns that institutional traders use to maximize returns.
- ✅ Identify the "Golden Buying Window"
- ✅ Avoid high-risk correction cycles
- ✅ Backtested data from the last 20+ years