May 08, 2026 a 07:46 am
LUV: Dividend Analysis - Southwest Airlines Co.
Southwest Airlines Co. (LUV) has been a consistent dividend payer with a rich history spanning 45 years. Despite facing challenges typical in the airline industry, the company has managed a dividend yield of 1.86%. The prudent management of its dividend payout reflects both resilience and strategic foresight in capital allocation.
📊 Overview
Southwest Airlines operates within the competitive airline sector, maintaining a notable dividend yield of 1.8648%. The current dividend per share is modest at $0.739, highlighting its strategy of careful dividend distribution. Despite industry volatility, it boasts a remarkable dividend history spanning 45 years without recent cuts or suspensions.
| Metric | Details |
|---|---|
| Sector | Airline |
| Dividend Yield | 1.86% |
| Current Dividend Per Share | $0.739 |
| Dividend History | 45 years |
| Last Cut or Suspension | None |
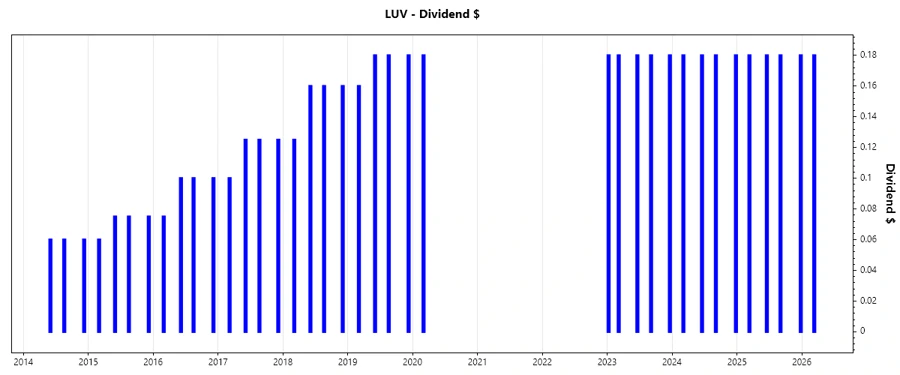
🗣️ Dividend History
Understanding dividend history can offer insights into a company’s reliability and commitment to shareholders. For Southwest Airlines, this record is a testament to its stable and shareholder-friendly approach over the decades.
| Year | Dividend Per Share (USD) |
|---|---|
| 2026 | $0.18 |
| 2025 | $0.72 |
| 2024 | $0.72 |
| 2023 | $0.90 |
| 2020 | $0.18 |
📈 Dividend Growth
Dividend growth is an essential factor in analyzing corporate health. Although Southwest Airlines Co. has experienced a modest 0.59% growth over 3 years and 0.32% over 5 years, this steady increase reflects its cautious approach in balancing growth with financial stability.
| Time | Growth |
|---|---|
| 3 years | 0.59% |
| 5 years | 0.32% |
The average dividend growth is 0.32% over 5 years. This shows moderate but steady dividend growth.
✅ Payout Ratio
The payout ratio indicates the proportion of earnings paid out as dividends. Southwest Airlines' EPS-based payout ratio stands at 45.04%, a healthy level showing sustainable dividend payout, while the FCF-based payout ratio at -90.06% might indicate potential cash flow challenges.
| Key Figure | Ratio |
|---|---|
| EPS-based | 45.04% |
| Free Cash Flow-based | -90.06% |
While the EPS-based ratio is reasonable, the negative FCF ratio suggests a liquidity mismatch in covering the dividends, which needs careful monitoring.
⚠️ Cashflow & Capital Efficiency
Analyzing cash flows and capital efficiency is vital to ascertain a company’s ability to sustain dividends. Despite some negative metrics, understanding these numbers provides insights into operational adjustments and growth potential.
| Metric | 2023 | 2024 | 2025 |
|---|---|---|---|
| Free Cash Flow Yield | -1.98% | -8.05% | -3.72% |
| Earnings Yield | 3.96% | 2.31% | 1.98% |
| CAPEX to Operating Cash Flow | 1.17% | 4.50% | 1.45% |
| Stock-based Compensation to Revenue | 0% | 0% | 0% |
| Free Cash Flow / Operating Cash Flow Ratio | -45.11% | -350.22% | -45.11% |
The mixed results in these figures indicate challenges in maintaining stable free cash flow positions, although other efficiency measures remain balanced.
📉 Balance Sheet & Leverage Analysis
An intricate understanding of balance sheet strength and leverage is crucial for gauging financial robustness. Southwest Airlines shows moderate leverage with a Debt-to-Equity ratio under 1, suggesting discipline in debt management.
| Metric | 2023 | 2024 | 2025 |
|---|---|---|---|
| Debt-to-Equity | 0.87 | 0.78 | 0.75 |
| Debt-to-Assets | 25.21% | 23.88% | 20.58% |
| Debt-to-Capital | 46.66% | 43.77% | 42.84% |
| Net Debt to EBITDA | -0.04 | 0.22 | 1.23 |
| Current Ratio | 1.14 | 0.92 | 0.52 |
| Quick Ratio | 1.07 | 0.85 | 0.45 |
| Financial Leverage | 3.47 | 3.26 | 3.64 |
Overall, while the company manages a stable debt profile, judicious cash flow management is necessary, especially with current and quick ratios below 1 in recent years.
✅ Fundamental Strength & Profitability
Southwest Airlines benefits from moderate profitability margins, indicative of prudent financial and operational management, which is necessary for sustaining its long-term dividend strategy.
| Metric | 2023 | 2024 | 2025 |
|---|---|---|---|
| Return on Equity | 4.42% | 4.49% | 5.53% |
| Return on Assets | 1.27% | 1.38% | 1.52% |
| Return on Invested Capital | 0.67% | 1.07% | 1.79% |
| Margins: Net, EBIT, EBITDA, Gross | 1.78%, 3.33%, 9.16%, 16.19% | 1.69%, 2.95%, 8.98%, 16.22% | 1.57%, 2.41%, 7.97%, 17.44% |
| Research & Development to Revenue | 0% | 0% | 0% |
The steady increase in ROE and maintaining decently low margins helps bolster confidence in the company's ability to yield reasonable returns on its reinvestments and assets.
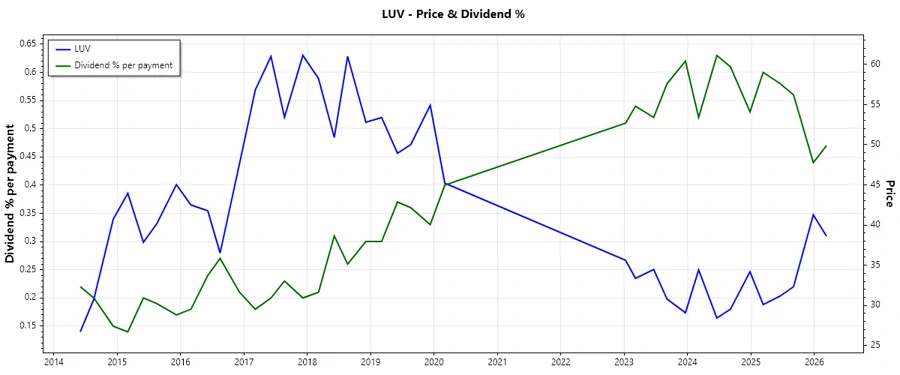
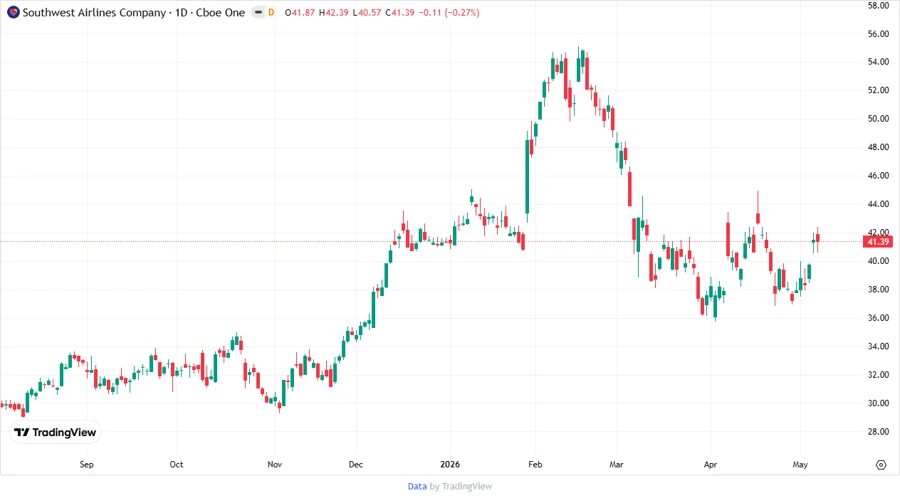
📊 Price Development
🔍 Dividend Scoring System
| Category | Score | Bar |
|---|---|---|
| Dividend Yield | 3 | |
| Dividend Stability | 4 | |
| Dividend Growth | 3 | |
| Payout Ratio | 3 | |
| Financial Stability | 3 | |
| Dividend Continuity | 4 | |
| Cashflow Coverage | 2 | |
| Balance Sheet Quality | 3 |
Overall Score: 25/40
⚖️ Rating
In conclusion, Southwest Airlines Co. presents as a relatively promising dividend stock characterized by its historical consistency and moderate growth prospects. Investors might consider it suitable for a diversified portfolio seeking stability through periodic income, although attention to cash flow metrics remains essential due to present challenges.
Smart Data Insight
Master the Perfect Entry & Exit for this Stock
Don't leave your profits to chance. Historically, this stock follows specific seasonal patterns that institutional traders use to maximize returns.
- ✅ Identify the "Golden Buying Window"
- ✅ Avoid high-risk correction cycles
- ✅ Backtested data from the last 20+ years