September 06, 2025 a 03:32 pm


LUV: Dividend Analysis - Southwest Airlines Co.
Southwest Airlines Co. presents a complex dividend landscape, reflecting a commitment to shareholder returns amidst financial challenges. With a dividend history spanning over 44 years, the airline has employed consistent payouts with its latest dividend yield positioned at 2.23%. However, high payout ratios and negative free cash flow yield indicate pressure on sustainable distribution, warranting caution for dividend-focused investors.
📊 Overview
| Metric | Value |
|---|---|
| Sector | Airlines |
| Dividend yield | 2.23 % |
| Current dividend per share | 0.72 USD |
| Dividend history | 44 years |
| Last cut or suspension | None |
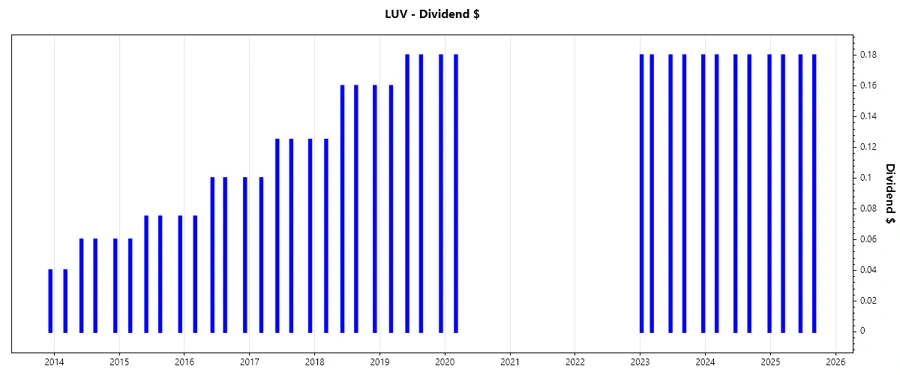
🗣️ Dividend History
Southwest Airlines has a rich dividend-paying heritage. The significance of understanding its historical dividend patterns lies in evaluating the company's commitment to rewarding shareholders consistently. Despite fluctuations inherent to the airline industry, Southwest's 44-year streak reflects resilience.
| Year | Dividend Per Share (USD) |
|---|---|
| 2025 | 0.54 |
| 2024 | 0.72 |
| 2023 | 0.90 |
| 2020 | 0.18 |
| 2019 | 0.70 |
📈 Dividend Growth
Dividend growth is a vital indicator of a company's earning power and financial health. Monitoring growth over three and five years provides insight into longer-term financial strategies and their effectiveness.
| Time | Growth |
|---|---|
| 3 years | 0.59 % |
| 5 years | 0.57 % |
The average dividend growth is 0.57 % over 5 years. This shows moderate but steady dividend growth.
⚠️ Payout Ratio
The payout ratio provides insight into how well earnings support dividends, with lower ratios generally indicating safer dividends. Southwest's high EPS-based payout of 98.69 % suggests potential strain on maintaining dividend levels.
| Key figure | Ratio |
|---|---|
| EPS-based | 98.69 % |
| Free cash flow-based | -138.33 % |
The almost full payout from earnings and negative free cash flow raise concerns about the sustainability of current dividends.
✅ Cashflow & Capital Efficiency
Examining cash flow stability and capital efficiency is essential for understanding a company's long-term viability. These metrics evaluate the financial health necessary to support dividend payments regularly.
| Metric | 2024 | 2023 | 2022 |
|---|---|---|---|
| Free Cash Flow Yield | -8.05% | -2.26% | -0.78% |
| Earnings Yield | 2.31% | 2.71% | 2.70% |
| CAPEX to Operating Cash Flow | 450.22% | 112.29% | 104.12% |
| Stock-based Compensation to Revenue | 0% | 0% | 0.35% |
| Free Cash Flow / Operating Cash Flow Ratio | -350.22% | -12.29% | -4.12% |
The data indicates significant cash flow challenges, with negative free cash flow yields and high capital expenditure ratios curtailing dividend coverage.
📊 Balance Sheet & Leverage Analysis
A comprehensive look at leverage and balance sheet statistics highlights financial robustness and the ability to service debt, crucial for sustaining dividend payments.
| Metric | 2024 | 2023 | 2022 |
|---|---|---|---|
| Debt-to-Equity | 0.78 | 0.87 | 0.89 |
| Debt-to-Assets | 0.24 | 0.25 | 0.27 |
| Debt-to-Capital | 0.44 | 0.47 | 0.47 |
| Net Debt to EBITDA | 0.22 | -0.04 | -0.01 |
| Current Ratio | 0.92 | 1.14 | 1.43 |
| Quick Ratio | 0.85 | 1.07 | 1.35 |
| Financial Leverage | 3.26 | 3.47 | 3.31 |
Southwest's higher debt ratios pose potential risks. The improvement in liquidity ratios, though, offers some reassurance regarding short-term obligations.
📈 Fundamental Strength & Profitability
Profitability and fundamental strength metrics determine a company's ability to generate profits, impacting potential dividend levels.
| Metric | 2024 | 2023 | 2022 |
|---|---|---|---|
| Return on Equity | 4.49% | 4.42% | 5.04% |
| Return on Assets | 1.38% | 1.27% | 1.52% |
| Net Profit Margin | 1.69% | 1.78% | 2.26% |
| Gross Profit Margin | 16.22% | 16.19% | 19.95% |
| EBIT Margin | 2.95% | 3.33% | 4.32% |
| EBITDA Margin | 8.98% | 9.16% | 9.99% |
| R&D to Revenue | 0% | 0% | 0% |
The data reflects modest profitability, constraining dividend increases. Stronger margins would provide more flexibility for consistent payment enhancements.
📊 Price Development
🌟 Dividend Scoring System
| Criteria | Rating | Score |
|---|---|---|
| Dividend yield | 3 | |
| Dividend Stability | 4 | |
| Dividend growth | 2 | |
| Payout ratio | 1 | |
| Financial stability | 2 | |
| Dividend continuity | 5 | |
| Cashflow Coverage | 1 | |
| Balance Sheet Quality | 3 |
Total Score: 21/40
🔍 Rating
Southwest Airlines Co. showcases a historic dividend track but is currently challenged by high payout ratios and negative free cash flow, making it a potentially risky choice for income-focused investors. While dividend continuity remains impressive, cautious evaluation is advised for future yield prospects.
Smart Data Insight
Master the Perfect Entry & Exit for this Stock
Don't leave your profits to chance. Historically, this stock follows specific seasonal patterns that institutional traders use to maximize returns.
- ✅ Identify the "Golden Buying Window"
- ✅ Avoid high-risk correction cycles
- ✅ Backtested data from the last 20+ years