
June 04, 2026 a 01:00 pm

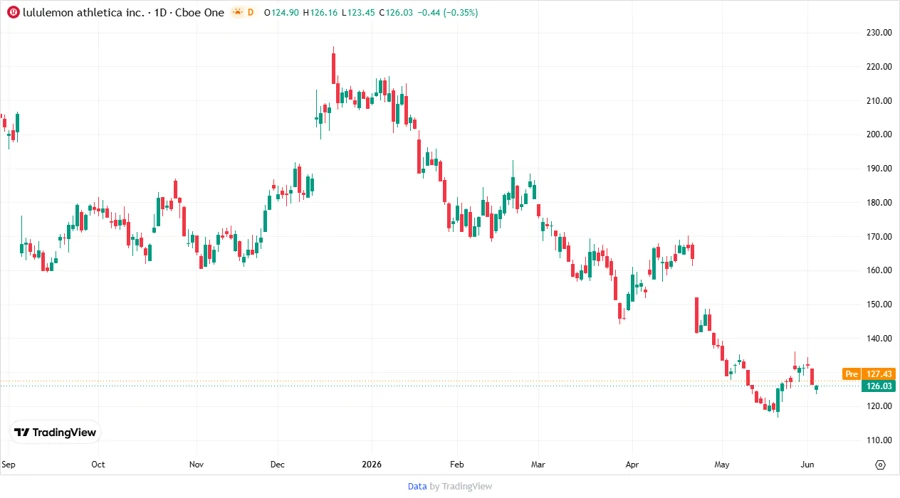
LULU: Fundamental Ratio Analysis - Lululemon Athletica Inc.
Lululemon Athletica Inc. has positioned itself strongly in the athletic apparel market with innovative products and strong brand recognition. The company's dual operational structure, encompassing both physical stores and a robust online platform, gives it resilience and growth opportunities. Analysts view the stock with a balanced perspective, highlighting both its stability and potential risks.
Fundamental Rating
The fundamentals of Lululemon suggest a solid financial standing with a few areas of improvement. Below are the evaluation categories with their corresponding scores:
| Category | Score | Visualization |
|---|---|---|
| Discounted Cash Flow | 4 | |
| Return on Equity | 5 | |
| Return on Assets | 5 | |
| Debt to Equity | 3 | |
| Price to Earnings | 3 | |
| Price to Book | 1 |
Historical Rating
The table below presents a comparison of Lululemon's past and current scores, showing consistency over time.
| Date | Overall | DCF | ROE | ROA | D/E | P/E | P/B |
|---|---|---|---|---|---|---|---|
| 2026-06-03 | 4 | 4 | 5 | 5 | 3 | 3 | 1 |
| 0 | 4 | 5 | 5 | 3 | 3 | 1 |
Analyst Price Targets
With a current median target of $210, the analyst's view appears cautiously optimistic. The following table summarizes the target price range:
| High | Low | Median | Consensus |
|---|---|---|---|
| $250 | $130 | $210 | $200.57 |
Analyst Sentiment
Analyst sentiment reveals a divided stance with a majority favoring holding the stock.
| Recommendation | Count | Visualization |
|---|---|---|
| Strong Buy | 0 | |
| Buy | 31 | |
| Hold | 35 | |
| Sell | 4 | |
| Strong Sell | 0 |
Conclusion
Lululemon Athletica Inc. demonstrates strong fundamentals, particularly in return metrics, yet carries certain valuation concerns. The analyst consensus is skewed towards holding, reflecting both confidence in the brand's market position and caution due to existing competition and pricing pressures. The company's strategic advantage lies in its dual-channel presence and brand loyalty, but market volatility remains a risk. Investors should weigh these factors carefully, considering potential catalysts or headwinds in the global retail landscape.
Smart Data Insight
Master the Perfect Entry & Exit for this Stock
Don't leave your profits to chance. Historically, this stock follows specific seasonal patterns that institutional traders use to maximize returns.
- ✅ Identify the "Golden Buying Window"
- ✅ Avoid high-risk correction cycles
- ✅ Backtested data from the last 20+ years