May 23, 2026 a 11:44 am

LULU: Fibonacci Analysis - Lululemon Athletica Inc.
Lululemon Athletica Inc. has shown dynamic price movements over recent months, characterized by both significant gains and retracements. The athletic apparel maker continues to leverage its strong brand presence and expansion into new markets and product categories. However, recent price data suggests a dominant downward trend, presenting potential risk for volatility-sensitive investors.
Fibonacci Analysis
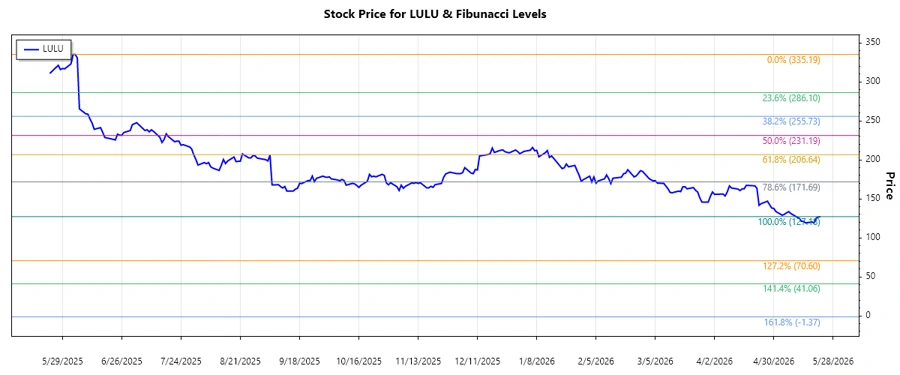
Based on the recent price data, Lululemon Athletica Inc. has experienced a notable downward trend. Leveraging the high of $335.19 on June 4th, 2025, and a low of $127.18 on May 22nd, 2026, we calculate the following Fibonacci retracement levels.
| Detail | Data |
|---|---|
| Trend Start Date | June 4th, 2025 |
| Trend End Date | May 22nd, 2026 |
| High Point | $335.19 (June 4th, 2025) |
| Low Point | $127.18 (May 22nd, 2026) |
| Current Price | $127.18 |
| Fibonacci Level | Price Level |
|---|---|
| 0.236 | $192.15 |
| 0.382 | $229.90 |
| 0.5 | $266.19 |
| 0.618 | $302.48 |
| 0.786 | $332.73 |
The current price is outside all major Fibonacci retracement zones, indicating potential continued weakness amidst the lack of a defined support level.
Conclusion
Lululemon's stock is currently oriented in a pronounced downward trend, as evidenced by recent price activity and key Fibonacci levels. Although the current price resides below all significant retracement levels, the absence of substantial support zones raises caution for potential investors. Long-term rebound could hinge on strengthening of fundamentals or significant external catalysts. Short-term traders should be alert for further volatility; longer-term, positives could emerge through strategic pivots and market stabilization.
Smart Data Insight
Master the Perfect Entry & Exit for this Stock
Don't leave your profits to chance. Historically, this stock follows specific seasonal patterns that institutional traders use to maximize returns.
- ✅ Identify the "Golden Buying Window"
- ✅ Avoid high-risk correction cycles
- ✅ Backtested data from the last 20+ years