September 29, 2025 a 05:15 am
LULU: Fibonacci Analysis - Lululemon Athletica Inc.
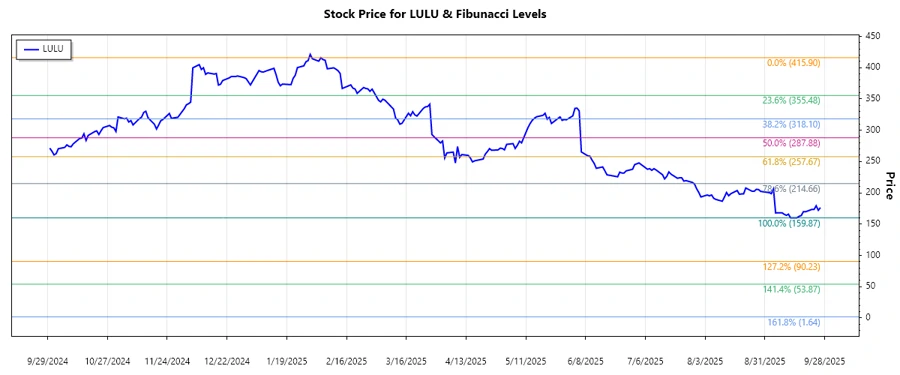
Lululemon Athletica Inc., a leader in athletic apparel, continues to show robust market performance. Recent data illustrates an overarching downward trend in its stock price over the past several months. As a key player in the industry, the company's innovative distribution channels and product offerings are pivotal in maintaining resilience amid market fluctuations. This analysis provides key insights into potential future movements based on technical indicators.
Fibonacci Analysis
| Trend Analysis | Details |
|---|---|
| Start Date | 2025-02-04 |
| End Date | 2025-09-26 |
| High Point | $415.90 on 2025-02-04 |
| Low Point | $159.87 on 2025-09-12 |
| Fibonacci Retracement Level | Price Level |
|---|---|
| 0.236 | $278.75 |
| 0.382 | $310.62 |
| 0.5 | $337.88 |
| 0.618 | $365.14 |
| 0.786 | $396.40 |
As of the current date, the LULU stock is trading at $176.30, suggesting that it is below the 0.236 Fibonacci retracement level. This indicates that the stock is continuing its downward trend, with no immediate retracement into higher Fibonacci zones.
Conclusion
The ongoing downward trend in Lululemon's stock presents both challenges and opportunities for investors. The failure to retrace into higher Fibonacci levels suggests sustained bearish sentiment. However, the strong brand presence and innovative product lines may serve as future catalysts for recovery. Analysts will be keenly observing market conditions and strategic developments within the company to assess potential entry points for investment amid this downturn.
Smart Data Insight
Master the Perfect Entry & Exit for this Stock
Don't leave your profits to chance. Historically, this stock follows specific seasonal patterns that institutional traders use to maximize returns.
- ✅ Identify the "Golden Buying Window"
- ✅ Avoid high-risk correction cycles
- ✅ Backtested data from the last 20+ years