February 12, 2026 a 04:03 am
LRCX: Trend and Support & Resistance Analysis - Lam Research Corporation
The stock of Lam Research Corporation is currently experiencing a notable trend. With its specialization in semiconductor processing equipment, the company's market performance shows interesting dynamics. Based on the recent technical analysis, LRCX has shown fluctuations with discernible trends and critical support and resistance zones. As the semiconductor industry plays a pivotal role globally, keeping a close eye on any movement of LRCX might provide insightful opportunities for investors.
Trend Analysis
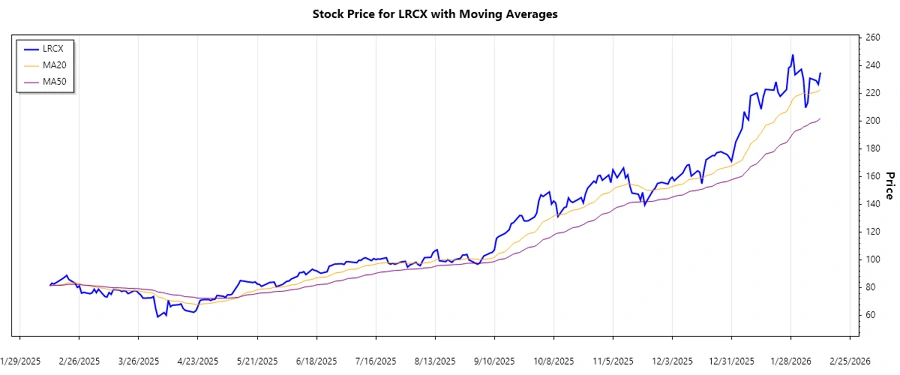
Over the recent months, analysis of the closing prices indicates that the stock has demonstrated significant trends. Calculating the EMA20 and EMA50, we're able to discern the dominant movement within the stock price. On analyzing the recent data, it becomes clear that:
| Date | Closing Price | Trend |
|---|---|---|
| 2026-02-11 | $235.12 | ▲ |
| 2026-02-10 | $226.61 | ▼ |
| 2026-02-09 | $229.28 | ▼ |
| 2026-02-06 | $231.01 | ▲ |
| 2026-02-05 | $213.31 | ▼ |
| 2026-02-04 | $209.78 | ▼ |
| 2026-02-03 | $230.10 | ▲ |
Based on the EMA calculation, LRCX is currently in an upward trend, evidenced by the EMA20 surpassing EMA50 values. Such patterns typically indicate potential positive market momentum.
Support- and Resistance
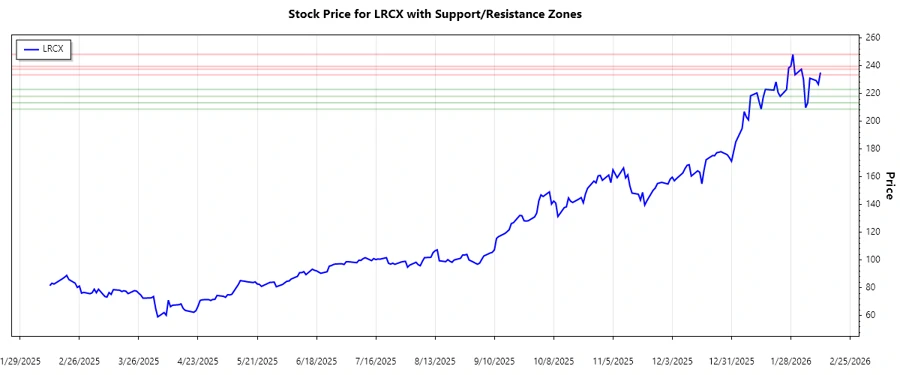
Analyzing the stock's recent performance identifies key support and resistance levels which are pivotal for future price action predictions. The determined zones were:
| Zone Type | From | To |
|---|---|---|
| Support Zone | ▲ $217.94 | ▲ $222.87 |
| Support Zone | ▼ $208.79 | ▼ $213.31 |
| Resistance Zone | ▼ $237.5 | ▼ $248.17 |
| Resistance Zone | ▲ $233.46 | ▲ $239.58 |
With the current closing price $235.12, it is within the resistance zone identified between $233.46 and $239.58. This can denote potential selling pressure as investors may capitalize on gains.
Conclusion
The analysis of Lam Research Corporation reveals that while it is currently in an upward trend, attention should be paid to imminent resistance zones. The interplay between market dynamics and the company's positioning within the semiconductor industry could manifest both opportunities and risks for investors. Understanding support and resistance plays within price levels can aid stakeholders in strategizing their positions. Doubling down on market performance, investors should factor in industry-specific developments and potential volatility. Consistently monitoring the technical indicators could lead to informed decision-making to mitigate risks. Overall, a nuanced approach towards the LRCX stock is advised, given the complexities of the semiconductor market.