
July 07, 2026 a 11:43 am
LRCX: Fundamental Ratio Analysis - Lam Research Corporation
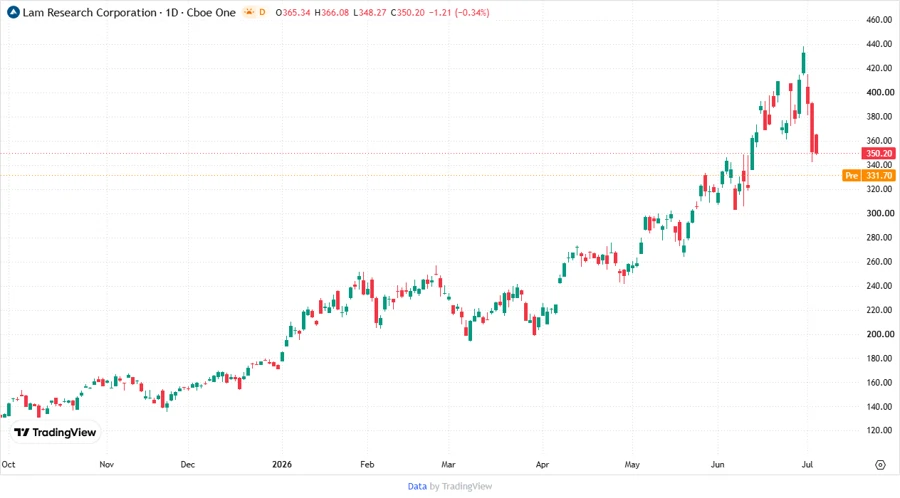
Lam Research Corporation is a vital player in the semiconductor industry, providing critical equipment essential for integrated circuit production. The company's expertise in deposition and etching technologies makes it indispensable to global semiconductor manufacturing. With a comprehensive product lineup, Lam Research caters to various wafer processing needs across multiple regions.
Fundamental Rating
Lam Research Corporation has demonstrated a solid performance with its fundamental metrics. Below are the key evaluation categories and their respective scores:
| Category | Score | Visualization |
|---|---|---|
| Discounted Cash Flow | 3 | |
| Return on Equity | 5 | |
| Return on Assets | 5 | |
| Debt to Equity | 2 | |
| Price to Earnings | 2 | |
| Price to Book | 1 |
Historical Rating
The historical performance shows consistency in the evaluation categories for Lam Research Corporation:
| Date | Overall | DCF | ROE | ROA | Debt to Equity | P/E | P/B |
|---|---|---|---|---|---|---|---|
| 2026-07-06 | 3 | 3 | 5 | 5 | 2 | 2 | 1 |
| Previous | 0 | 3 | 5 | 5 | 2 | 2 | 1 |
Analyst Price Targets
Analyst evaluations suggest a promising outlook for LRCX with substantial upside potential:
| High | Low | Median | Consensus |
|---|---|---|---|
| $500 | $275 | $355 | $365.22 |
Analyst Sentiment
The sentiment among analysts is predominantly positive, indicating a strong buy consensus:
| Recommendation | Count | Visualization |
|---|---|---|
| Strong Buy | 0 | |
| Buy | 39 | |
| Hold | 10 | |
| Sell | 1 | |
| Strong Sell | 0 |
Conclusion
Lam Research Corporation demonstrates robust financials and a strong market position, which gives it a favorable outlook. Its critical role in the semiconductor industry, coupled with innovative products, offers significant growth opportunities. While the current leverage ratio poses a minor risk, the company's strategic focus and product diversification help mitigate potential challenges. Analyst sentiments further support a positive stock performance trajectory, indicating potential investment appeal.
Smart Data Insight
Master the Perfect Entry & Exit for this Stock
Don't leave your profits to chance. Historically, this stock follows specific seasonal patterns that institutional traders use to maximize returns.
- ✅ Identify the "Golden Buying Window"
- ✅ Avoid high-risk correction cycles
- ✅ Backtested data from the last 20+ years