May 16, 2026 a 12:46 pm

LRCX: Dividend Analysis - Lam Research Corporation
Lam Research Corporation, a key player in the semiconductor manufacturing industry, exhibits a balanced dividend profile. Its consistent dividend history and strategic financial management reflect moderate growth and stability. Despite a modest dividend yield, the company's ability to maintain and steadily grow dividends over the years is commendable. The robust fundamentals and a low payout ratio suggest potential for future dividend increases.
📊 Overview
The following table provides a snapshot of Lam Research Corporation's dividend profile and sector details:
| Detail | Value |
|---|---|
| Sector | Semiconductor Manufacturing |
| Dividend yield | 0.45% |
| Current dividend per share | 0.89 USD |
| Dividend history | 13 years |
| Last cut or suspension | None |
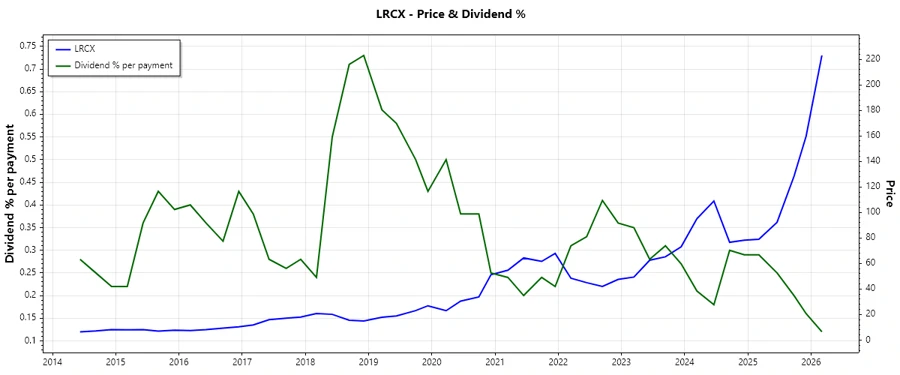
📈 Dividend History
Lam Research Corporation has a solid dividend history, reflecting its commitment to returning value to shareholders. Consistency in dividend payments highlights the company's sustained profitability and cash flow stability.
| Year | Dividend per Share (USD) |
|---|---|
| 2026 | 0.26 |
| 2025 | 0.98 |
| 2024 | 0.86 |
| 2023 | 0.7450 |
| 2022 | 0.6450 |
📈 Dividend Growth
The ability to grow dividends is a key indicator of a company's financial health and growth prospects. Lam Research Corporation has demonstrated moderate yet steady dividend growth over the past years.
| Time | Growth |
|---|---|
| 3 years | 14.96% |
| 5 years | 14.87% |
The average dividend growth is 14.87% over 5 years. This shows moderate but steady dividend growth.
🗣️ Payout Ratio
The payout ratio is essential to assess if a company can sustain dividend payments. A lower ratio typically suggests more room for dividend growth.
| Key figure | Ratio |
|---|---|
| EPS-based | 16.65% |
| Free cash flow-based | 17.33% |
The low EPS-based (16.65%) and FCF-based (17.33%) payout ratios are indications of Lam Research Corporation's capacity to maintain and potentially increase its dividend payments.
♻️ Cashflow & Capital Efficiency
Evaluating cash flow and capital efficiency provides insights into the sustainability of dividend payments and the company’s growth potential.
| Year | 2025 | 2024 | 2023 |
|---|---|---|---|
| Free Cash Flow Yield | 4.32% | 3.05% | 5.57% |
| Earnings Yield | 4.28% | 2.74% | 5.37% |
| CAPEX to Operating Cash Flow | 12.30% | 8.53% | 9.68% |
| Stock-based Compensation to Revenue | 1.86% | 1.97% | 1.64% |
| Free Cash Flow / Operating Cash Flow Ratio | 87.70% | 91.47% | 90.32% |
The steady Free Cash Flow Yield and reasonable CAPEX allocation to operating cash flow signify effective cash management, promoting sustainable dividend growth.
⚖️ Balance Sheet & Leverage Analysis
A strong balance sheet ensures a company can weather economic downturns and uphold its dividend policy.
| Year | 2025 | 2024 | 2023 |
|---|---|---|---|
| Debt-to-Equity | 0.48 | 0.58 | 0.61 |
| Debt-to-Assets | 0.22 | 0.27 | 0.27 |
| Debt-to-Capital | 0.33 | 0.37 | 0.38 |
| Net Debt to EBITDA | -0.26 | -0.18 | -0.06 |
| Current Ratio | 2.54 | 2.21 | 3.16 |
| Quick Ratio | 1.55 | 2.00 | 2.01 |
| Financial Leverage | 2.16 | 2.20 | 2.29 |
Lam Research Corporation's prudent debt management and solid leverage ratios indicate a healthy financial structure to weather adverse financial scenarios.
📊 Fundamental Strength & Profitability
Strong fundamentals and profitability ratios provide assurance about the ongoing and future dividend payouts.
| Year | 2025 | 2024 | 2023 |
|---|---|---|---|
| Return on Equity | 54.33% | 44.82% | 54.94% |
| Return on Assets | 25.10% | 20.42% | 24.02% |
| Margins: Net | 29.06% | 25.68% | 25.89% |
| EBIT | 32.32% | 30.50% | 30.39% |
| EBITDA | 34.41% | 32.91% | 32.35% |
| Gross | 48.71% | 47.32% | 44.63% |
| Research & Development to Revenue | 10.67% | 12.76% | 9.91% |
The strong return metrics and maintained profit margins underscore Lam Research Corporation's efficacy in utilizing its resources for profit generation.
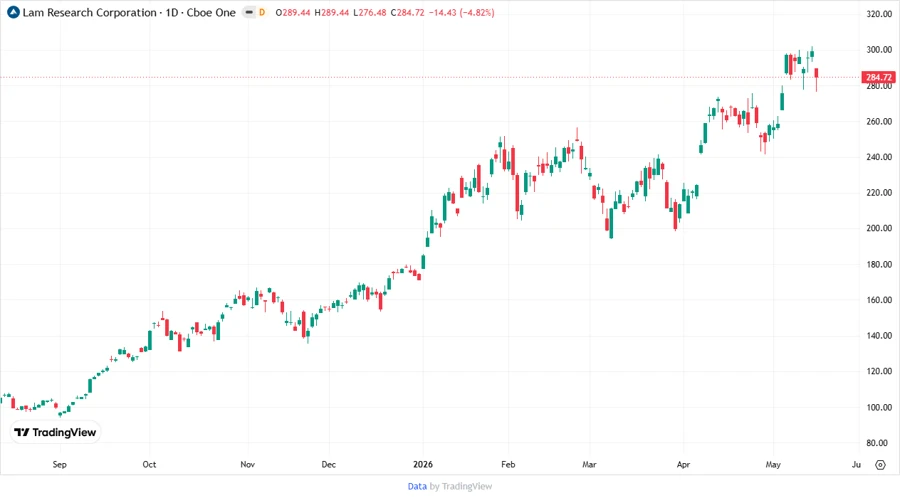
📉 Price Development
✅ Dividend Scoring System
| Criteria | Score (1-5) | Score Bar |
|---|---|---|
| Dividend yield | 3 | |
| Dividend Stability | 4 | |
| Dividend growth | 4 | |
| Payout ratio | 5 | |
| Financial stability | 4 | |
| Dividend continuity | 4 | |
| Cashflow Coverage | 4 | |
| Balance Sheet Quality | 5 |
Total Score: 33/40
🔍 Rating
Overall, Lam Research Corporation exhibits a strong dividend profile with a commendable history of payments and moderate growth prospects. The company’s low payout ratios, strong balance sheet, and steady cash flow management position it well for future dividend stability. It is a recommended hold for dividend-focused investors seeking stability and gradual growth.
Smart Data Insight
Master the Perfect Entry & Exit for this Stock
Don't leave your profits to chance. Historically, this stock follows specific seasonal patterns that institutional traders use to maximize returns.
- ✅ Identify the "Golden Buying Window"
- ✅ Avoid high-risk correction cycles
- ✅ Backtested data from the last 20+ years