December 09, 2025 a 03:31 pm


LRCX: Dividend Analysis - Lam Research Corporation
Lam Research Corporation, a key player in the semiconductor equipment industry, offers an impressive dividend profile characterized by its stable and growing payouts. The company maintains a conservative payout ratio, ensuring a sustainable yield for its investors. With its robust market capitalization and strategic dividend policies, Lam Research demonstrates financial resilience and a commitment to rewarding its shareholders.
📊 Overview
Lam Research operates within the technology sector, specifically focusing on semiconductor production equipment design and services. The company showcases a modest dividend yield, reflecting a balance between reinvestment in innovation and shareholder rewards.
| Criteria | Details |
|---|---|
| Sector | Technology |
| Dividend Yield | 0.61% |
| Current Dividend per Share | 0.89 USD |
| Dividend History | 12 years |
| Last Cut or Suspension | None |
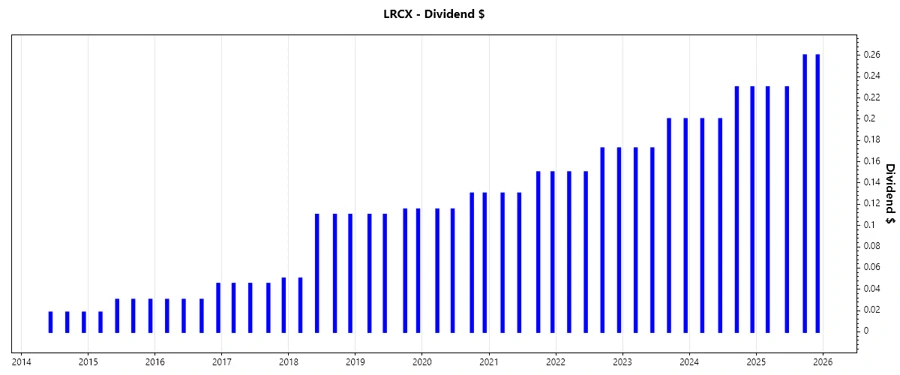
📈 Dividend History
Lam Research has consistently increased its dividend over the past years, indicating a reliable income stream for investors. With a record of 12 uninterrupted years, this depicts a strong commitment to shareholder returns.
| Year | Dividend per Share (USD) |
|---|---|
| 2025 | 0.98 |
| 2024 | 0.86 |
| 2023 | 0.7450 |
| 2022 | 0.6450 |
| 2021 | 0.56 |
📈 Dividend Growth
The company's dividend growth, marking 15.37% over 3 years and 13.83% over 5 years, demonstrates Lam Research's effective capital allocation and commitment to increasing shareholder value. This pattern of growth is crucial for assessing the potential for future income increments.
| Time | Growth |
|---|---|
| 3 years | 15.37% |
| 5 years | 13.83% |
The average dividend growth is 13.83% over 5 years. This shows moderate but steady dividend growth.
⚠️ Payout Ratio
Maintaining payout ratios based on EPS at 19.45% and FCF at 19.19%, Lam Research showcases an efficient profit reinvestment strategy, leaving ample room for organic growth and financial flexibility.
| Key Figure Ratio | Percentage |
|---|---|
| EPS-based | 19.45% |
| Free Cash Flow-based | 19.19% |
These low payout ratios suggest that Lam Research efficiently manages its capital, making sure that the dividends are sustainable and do not hinder the company’s potential to invest in future growth.
💸 Cashflow & Capital Efficiency
Analyzing the cash flow and capital efficiency of Lam Research reveals insights into its operational health and sustainability. The company presents strong figures in free cash flow yield and earnings yield, which are paramount for evaluating liquidity and operational performance.
| Year | 2023 | 2024 | 2025 |
|---|---|---|---|
| Free Cash Flow Yield | 5.37% | 3.05% | 4.32% |
| Earnings Yield | 5.18% | 2.75% | 4.28% |
| CAPEX to Operating Cash Flow | 9.68% | 8.52% | 12.30% |
| Stock-based Compensation to Revenue | 1.64% | 1.97% | 1.86% |
| Free Cash Flow / Operating Cash Flow Ratio | 90.32% | 91.47% | 87.70% |
Overall, Lam Research exhibits robust cash flow management and capital efficiency, supporting its dividend payouts and reinvestment strategies effectively.
🏦 Balance Sheet & Leverage Analysis
The balance sheet analysis of Lam Research indicates a well-managed leverage strategy. With a healthy mix of debt-to-equity and strong coverage ratios, the company portrays financial stability, which is critical for long-term viability and growth potential.
| Year | 2023 | 2024 | 2025 |
|---|---|---|---|
| Debt-to-Equity | 0.61 | 0.58 | 0.48 |
| Debt-to-Assets | 0.27 | 0.27 | 0.22 |
| Debt-to-Capital | 0.38 | 0.37 | 0.33 |
| Net Debt to EBITDA | -0.06 | -0.18 | -0.26 |
| Current Ratio | 3.16 | 2.97 | 2.21 |
| Quick Ratio | 2.01 | 2.00 | 1.55 |
| Financial Leverage | 2.29 | 2.20 | 2.16 |
Lam Research's disciplined financial management with a low leverage approach provides a strong shield against market volatility, reinforcing its ability to meet long-term obligations comfortably.
📈 Fundamental Strength & Profitability
Lam Research's strong profitability metrics, driven by excellent returns on equity and assets, underscore its operational efficiency. The profitability margins reflect effective cost management and competitive strength in the industry.
| Year | 2023 | 2024 | 2025 |
|---|---|---|---|
| Return on Equity | 54.94% | 44.82% | 54.33% |
| Return on Assets | 24.02% | 20.42% | 25.10% |
| Net Margin | 25.89% | 25.68% | 29.06% |
| EBIT Margin | 30.39% | 30.50% | 32.32% |
| EBITDA Margin | 32.35% | 32.91% | 34.41% |
| Gross Margin | 44.63% | 47.32% | 48.71% |
| R&D to Revenue | 9.91% | 12.76% | 11.14% |
The financial health of Lam Research, evidenced by robust profitability metrics, positions the company favorably among its peers, ensuring sustained growth and shareholder value creation.
📉 Price Development
✅ Dividend Scoring System
| Category | Score | Score Bar |
|---|---|---|
| Dividend Yield | 3 | |
| Dividend Stability | 5 | |
| Dividend Growth | 4 | |
| Payout Ratio | 5 | |
| Financial Stability | 5 | |
| Dividend Continuity | 5 | |
| Cashflow Coverage | 4 | |
| Balance Sheet Quality | 5 |
Total Score: 36/40
🔍 Rating
In summary, Lam Research Corporation demonstrates outstanding financial strength, stability, and a consistent track record of rewarding shareholders through dividends. The company's strategic financial management, robust profitability, and growth metrics render it a compelling choice for investors seeking steady income and potential capital appreciation. With a total score of 36 out of 40 in our Dividend Scoring System, Lam Research is a highly recommended dividend stock for any well-diversified portfolio.