September 01, 2025 a 07:32 am

LRCX: Dividend Analysis - Lam Research Corporation
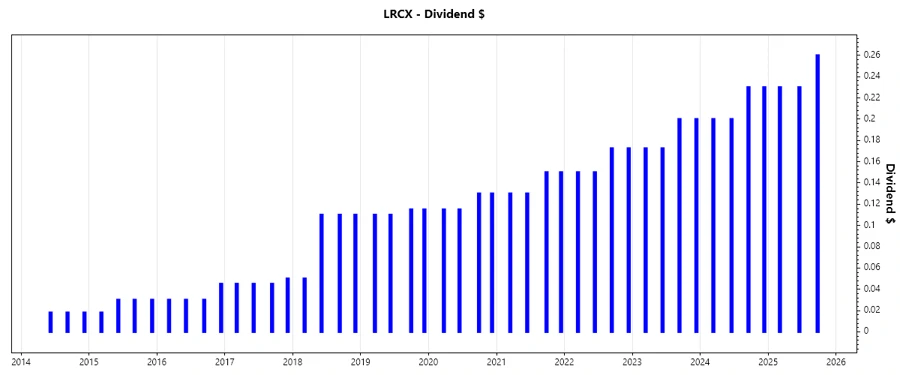
LRCX has shown consistent performance in its dividend strategy. With a dividend yield of 0.95% and a history spanning over 12 years, the company reflects a stable dividend approach. However, a detailed analysis of its payout ratios and cash flow statements is crucial to gauge sustainability and growth potential. Lam Research Corporation has room to grow its dividends while keeping a balance with its capital expenditures and other financial commitments.
Overview 📊
Lam Research Corporation operates in the competitive sector of technology, providing advanced tools for semiconductor manufacturers. Its dividend yield of 0.95% is modest, reflecting a careful balance between rewarding shareholders and retaining earnings for future growth. The company's commitment to maintaining a dividend history over 12 years, without any cut or suspension, underscores its financial resilience and strategic foresight.
| Metric | Value |
|---|---|
| Sector | Technology |
| Dividend yield | 0.95% |
| Current dividend per share | $0.89 |
| Dividend history | 12 years |
| Last cut or suspension | None |
Dividend History 📉
A well-documented dividend history is crucial in assessing long-term value for investors. Lam Research's stable and predictable payout profile appeals to conservative income investors. Understanding the timing and trend of past dividends helps in projecting future payouts.
| Year | Dividend per Share (USD) |
|---|---|
| 2025 | $0.72 |
| 2024 | $0.86 |
| 2023 | $0.75 |
| 2022 | $0.65 |
| 2021 | $0.56 |
Dividend Growth 📈
Dividend growth is an essential factor for long-term investors as it indicates the possibility of increased income over time. Lam Research shows a modest growth rate of 15.37% over 3 years and 13.83% over 5 years. This demonstrates the company's capability to enhance shareholder returns without compromising financial stability.
| Time | Growth |
|---|---|
| 3 years | 15.37% |
| 5 years | 13.83% |
The average dividend growth is 13.83% over 5 years. This shows moderate but steady dividend growth.
Payout Ratio 🗣️
Payout ratios help investors understand the portion of earnings and cash flow paid as dividends. With a prudent EPS-based payout ratio of 21.26% and a free cash flow-based payout ratio of 19.80%, Lam Research ensures its dividends are sustainable and leaves room to reinvest in business growth.
| Key figure | Ratio |
|---|---|
| EPS-based | 21.26% |
| Free cash flow-based | 19.80% |
The EPS payout ratio suggests ample room for dividend increases, while the FCF payout ratio aligns with aggressive investment strategies aiming for long-term growth.
Cashflow & Capital Efficiency ✅
An analysis of cash flow efficiency reveals the company's ability to generate liquidity and manage operational capital. High free cash flow yield and efficient CAPEX allocations are crucial for future investment opportunities and sustaining dividend payments.
| 2025 | 2024 | 2023 | |
|---|---|---|---|
| Free Cash Flow Yield | 4.32% | 3.05% | 5.57% |
| Earnings Yield | 4.28% | 2.75% | 5.37% |
| CAPEX to Operating Cash Flow | 12.30% | 8.53% | 9.68% |
| Stock-based Compensation to Revenue | 1.86% | 1.97% | 1.64% |
| Free Cash Flow / Operating Cash Flow Ratio | 87.70% | 91.47% | 90.32% |
The stable cash flow generation coupled with prudent capital investment indicates satisfactory operational efficiency, critical for long-term financial health.
Balance Sheet & Leverage Analysis ⚠️
A solid balance sheet is fundamental for a company's ability to weather financial storms. Lam Research shows a healthy debt-to-equity ratio and robust current and quick ratios, supporting its strong liquidity and reduced leverage risk.
| 2025 | 2024 | 2023 | |
|---|---|---|---|
| Debt-to-Equity | 0.45 | 0.58 | 0.61 |
| Debt-to-Assets | 0.21 | 0.27 | 0.27 |
| Debt-to-Capital | 0.31 | 0.37 | 0.38 |
| Net Debt to EBITDA | -0.29 | -0.18 | -0.06 |
| Current Ratio | 2.21 | 0.00 | 0.00 |
| Quick Ratio | 1.55 | 2.00 | 2.01 |
| Financial Leverage | 2.16 | 2.20 | 2.29 |
With the low net debt to EBITDA and strong solvency metrics, Lam Research is positioned to manage its liabilities effectively and uphold its dividend commitments.
Fundamental Strength & Profitability 📈
Evaluating profitability is key for assessing a firm's inherent strength. Lam Research shows notable ROE and ROA metrics, reflecting efficient use of equity and assets.
| 2025 | 2024 | 2023 | |
|---|---|---|---|
| Return on Equity | 54.33% | 44.82% | 54.94% |
| Return on Assets | 25.10% | 20.42% | 24.02% |
| Margins: Net | 29.06% | 25.68% | 25.89% |
| Margins: EBIT | 32.32% | 30.50% | 30.39% |
| Margins: EBITDA | 34.41% | 32.91% | 32.35% |
| Margins: Gross | 48.71% | 47.32% | 44.63% |
| R&D to Revenue | 11.37% | 12.76% | 9.91% |
Lam Research assures its financial and operational status by maintaining high profitability margins, which are crucial for securing investment and supporting growth strategies.
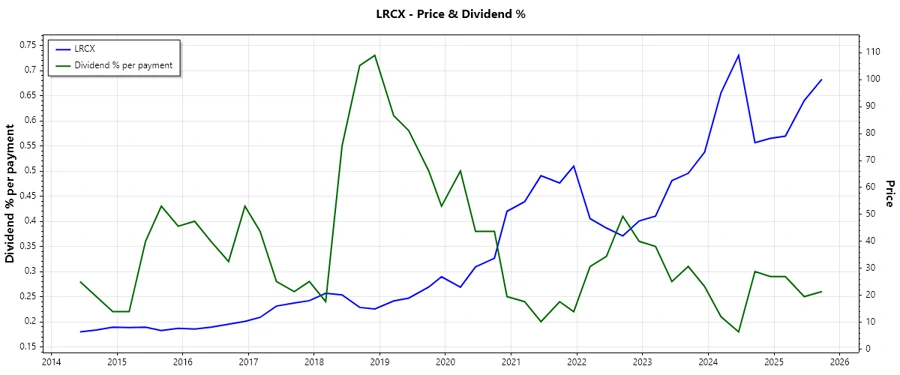
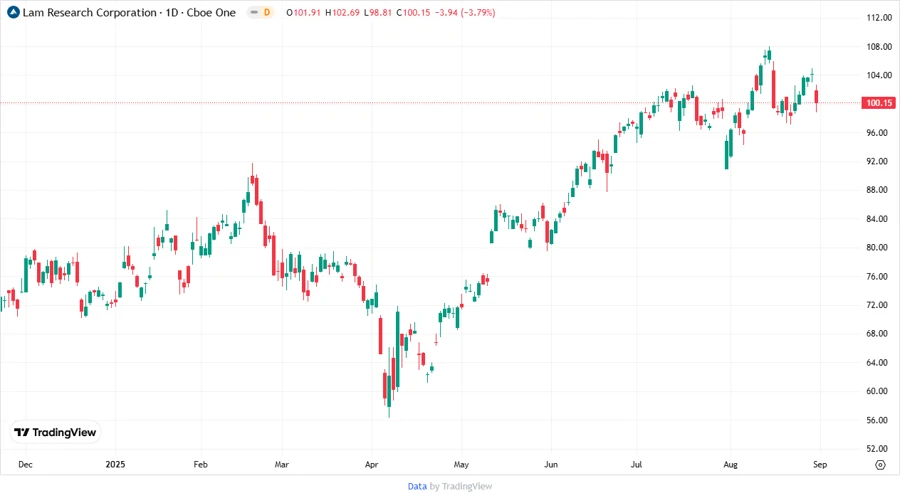
Price Development 📉
Dividend Scoring System 📝
| Criteria | Score out of 5 | Score Bar |
|---|---|---|
| Dividend yield | 3 | |
| Dividend Stability | 4 | |
| Dividend growth | 4 | |
| Payout ratio | 4 | |
| Financial stability | 5 | |
| Dividend continuity | 5 | |
| Cashflow Coverage | 4 | |
| Balance Sheet Quality | 5 |
Total Score: 34/40
Rating
LRCX presents a robust dividend profile with strong stability and growth prospects. Supported by a solid financial foundation and growth in its dividend payments, Lam Research is a viable investment option for income-seeking investors who value stability and prudent financial management. The company's commitment to maintaining a healthy balance sheet and efficient capital allocation enhances its appeal as a long-term investment.
Smart Data Insight
Master the Perfect Entry & Exit for this Stock
Don't leave your profits to chance. Historically, this stock follows specific seasonal patterns that institutional traders use to maximize returns.
- ✅ Identify the "Golden Buying Window"
- ✅ Avoid high-risk correction cycles
- ✅ Backtested data from the last 20+ years