November 01, 2025 a 09:03 am
LOW: Trend and Support & Resistance Analysis - Lowe's Companies, Inc.
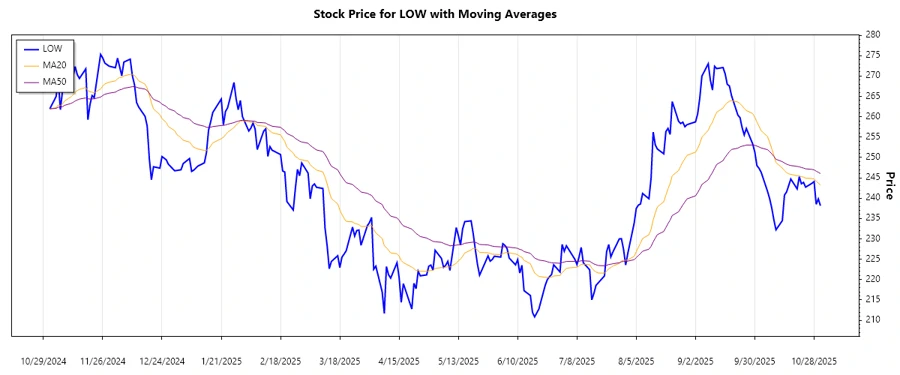
Lowe's stock has been demonstrating mixed signals over the past few months. As a prominent home improvement retailer, the fluctuations in its stock are somewhat aligned with market trends and economic conditions impacting consumer spending in the home improvement sector. In recent data analysis, the EMA indicators suggest a downward trend, pointing to potential investor caution. Tracking the technical indicators reveals key support and resistance levels which may guide trading strategies.
Trend Analysis
| Date | Closing Price | Trend |
|---|---|---|
| 2025-10-31 | $238.13 | ▼ |
| 2025-10-30 | $239.82 | ▼ |
| 2025-10-29 | $238.49 | ▼ |
| 2025-10-28 | $244.07 | ▲ |
| 2025-10-27 | $243.65 | ▲ |
| 2025-10-24 | $242.71 | ▲ |
| 2025-10-23 | $243.87 | ▲ |
Based on the calculated EMA20 and EMA50, the trend direction for LOW is currently showing signs of a downtrend as the EMA20 < EMA50. This indicates a bearish sentiment in the short term.
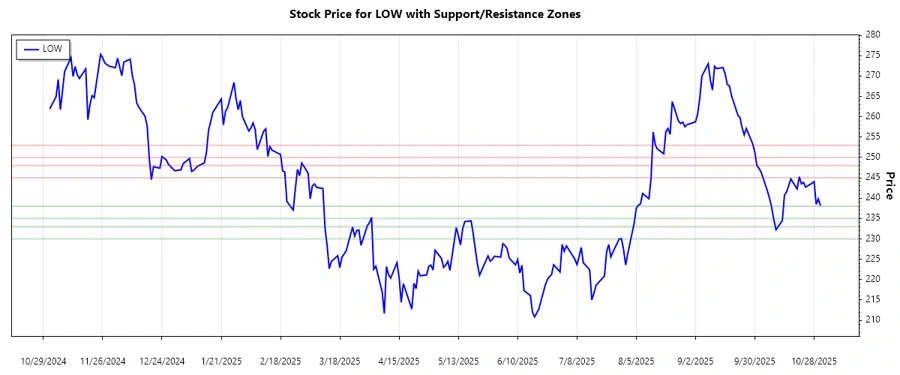
Support and Resistance
| Zone Type | From | To |
|---|---|---|
| Support 1 | $235.00 | $238.00 |
| Support 2 | $230.00 | $233.00 |
| Resistance 1 | $245.00 | $248.00 |
| Resistance 2 | $250.00 | $253.00 |
Currently, the price is hovering near the upper support zone at $238.13, suggesting that it might enter a consolidation phase if this level holds. Observing these areas helps anticipate potential price reactions.
Conclusion
The analysis of Lowe's Companies, Inc. indicates a recent bearish trend, inferred from EMA readings and price action. With significant support around $235, downward pressure may be halted if buyers step in. Meanwhile, resistance tightly holds at $248, posing a challenge to any bullish turnaround. Investors should consider market volatility and broader economic conditions when making trading decisions. As Lowe's navigates market challenges, efficiency and strategic shifts will be vital. Engagement with these technical zones will likely shape short-term trading tactics.