August 19, 2025 a 02:04 pm


LOW: Trend and Support & Resistance Analysis - Lowe's Companies, Inc.
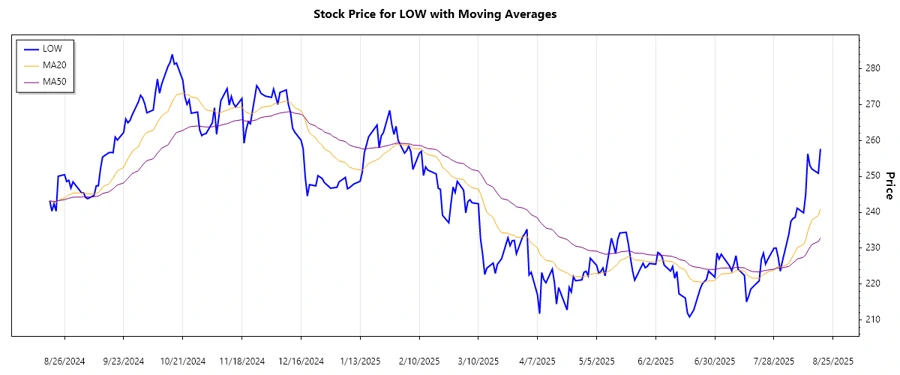
The stock of Lowe's Companies, Inc. has exhibited a notable performance in recent months, reflecting both the resilience of the home improvement sector and the company's strategic initiatives. Backed by strong brand recognition and diverse product offerings, Lowe's has maintained its appeal among both retail customers and professional contractors. However, market fluctuations and economic uncertainties continue to challenge its stock price movements.
Trend Analysis
Lowe's Companies, Inc. has experienced varying trends over the recent period, driven by external market conditions and internal strategic actions. The calculation of moving averages indicates a consistent change in momentum.
| Date | Close Price | Trend |
|---|---|---|
| 2025-08-19 | 257.68 | ▲ |
| 2025-08-18 | 250.89 | ▲ |
| 2025-08-15 | 252.06 | ▲ |
| 2025-08-14 | 253.05 | ▲ |
| 2025-08-13 | 256.33 | ▲ |
| 2025-08-12 | 244.87 | ▲ |
| 2025-08-11 | 239.85 | ▲ |
In conclusion, the recent trend indicates an upward movement, as evidenced by the ascending price points and the EMA(20) surpassing the EMA(50). This suggests a bullish momentum, although cautious optimism is advised due to market volatility.
Support and Resistance Analysis
Support and resistance zones provide insight into the potential price barriers and support levels critical to stock movement.
| Zone Type | From | To | |
|---|---|---|---|
| Support 1 | 230.00 | 236.00 | ↑ |
| Support 2 | 220.00 | 225.00 | ↑ |
| Resistance 1 | 260.00 | 265.00 | ↓ |
| Resistance 2 | 270.00 | 275.00 | ↓ |
The current close price suggests that the stock is hovering near its resistance zone, indicating potential hurdles for upward movement. Investors should watch these levels closely for any breakthrough or reversal pattern.
Conclusion
Lowe's stock demonstrates a positive upward trend, indicating investor confidence and potential future growth. However, current resistance zones necessitate cautious trading strategies. As Lowe's continues to leverage its market position, uncertainties persist, presenting both opportunities and risks. Analysts should closely monitor external economic factors and company metrics to make informed investment decisions.
Smart Data Insight
Master the Perfect Entry & Exit for this Stock
Don't leave your profits to chance. Historically, this stock follows specific seasonal patterns that institutional traders use to maximize returns.
- ✅ Identify the "Golden Buying Window"
- ✅ Avoid high-risk correction cycles
- ✅ Backtested data from the last 20+ years