March 18, 2026 a 04:44 pm
LOW: Fibonacci Analysis - Lowe's Companies, Inc.
Lowe's Companies, Inc. has experienced a significant downtrend over the past months, largely driven by fluctuating market conditions and internal financial factors. As a leading home improvement retailer, the company's performance is closely tied to consumer spending and economic stability. Analysts are paying close attention to the current retracement levels to assess potential support, with the aim of identifying future opportunities for rebound or further decline.
Fibonacci Analysis
Detailed Fibonacci Retracement Levels
| Fibonacci Level | Price |
|---|---|
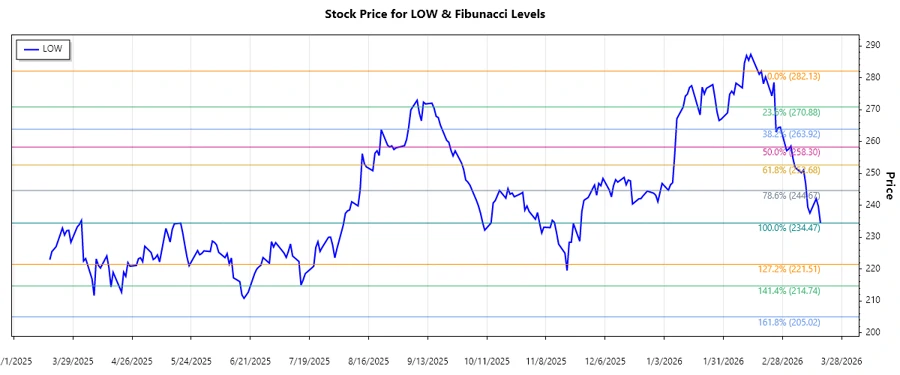
| 0.236 | $264.28 |
| 0.382 | $253.88 |
| 0.5 | $245.31 |
| 0.618 | $236.75 |
| 0.786 | $225.51 |
Trend Duration: November 18, 2025 - February 13, 2026
High: $282.13 (Date: 2026-02-18)
Low: $234.47 (Date: 2026-03-18)
Current Price: $234.47
Current Retracement Zone: 0.786
Interpretation: The current price is within the 0.786 Fibonacci retracement level, suggesting a potential area of support. If the price holds, it could indicate a possible reversal, but a break below can suggest further downward momentum.
Conclusion
The current technical setup for Lowe's Companies, Inc. suggests caution, as the stock trades near critical support levels. Analysts are exploring whether these levels can stave off further declines. While there’s potential for upward corrections, broader market trends and economic indicators will play a pivotal role. Investors should weigh these factors carefully, considering the inherent risks and potential for recovery. For those holding the stock, close monitoring of technical levels is advised, along with attention to upcoming market forecasts.