November 16, 2025 a 03:15 pm
LOW: Fibonacci Analysis - Lowe's Companies, Inc.
Lowe's Companies, Inc. has demonstrated a strong ability to navigate the challenges of the retail sector, with its comprehensive range of home improvement products. Despite recent volatility in the stock market, Lowe's remains a resilient entity due to its strategic initiatives and wide customer base. Investors should take note of the company's robust fundamentals and continued focus on digital sales channels, which could positively impact its stock performance in the future.
Fibonacci Analysis
| Start Date | End Date | High Point (Price & Date) | Low Point (Price & Date) |
|---|---|---|---|
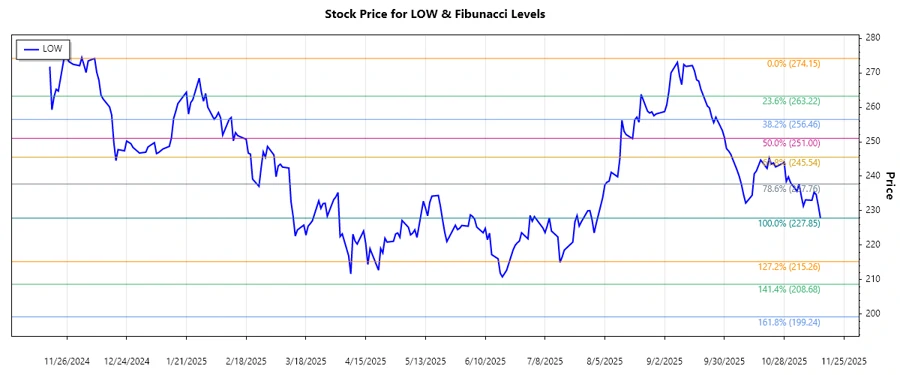
| 2024-12-09 | 2025-11-14 | $274.15 (2024-12-09) | $227.85 (2025-11-14) |
Fibonacci Levels
| Level | Price |
|---|---|
| 0.236 | $239.39 |
| 0.382 | $246.90 |
| 0.5 | $251.00 |
| 0.618 | $255.11 |
| 0.786 | $261.01 |
The current stock price is not within any significant Fibonacci retracement zone, indicating limited immediate support from these levels. Traders might want to monitor the $239.39 to $246.90 range for potential support or resistance signals moving forward.
Conclusion
Lowe's Companies, Inc. has shown a bearish trend from December 2024 to November 2025, characterized by a dominant downward movement in stock prices. While the company’s strategic strengths are evident, the current technical analysis suggests caution for short-term traders given the lack of strong retracement levels acting as support. On the upside, long-term investors might find value in the company's continuous adaptation and competitive position in the market. Evaluating further market conditions along with corporate performance metrics would be crucial to identify potential entry points.
Smart Data Insight
Master the Perfect Entry & Exit for this Stock
Don't leave your profits to chance. Historically, this stock follows specific seasonal patterns that institutional traders use to maximize returns.
- ✅ Identify the "Golden Buying Window"
- ✅ Avoid high-risk correction cycles
- ✅ Backtested data from the last 20+ years