June 21, 2025 a 12:46 pm


LOW: Dividend Analysis - Lowe's Companies, Inc.
Lowe's Companies, Inc. represents a compelling investment opportunity for income-focused investors. With a current dividend yield of 2.19% and a robust history of 41 consecutive years of dividend growth, the company underscores its commitment to shareholder value. Its prudent payout ratio suggests stability, making it a reliable choice for dividends. However, prospective investors should weigh the company's leverage levels, which may present potential risks.
Overview 📊
Lowe's operates within the Retail Sector, offering a mix of stability and growth potential. The firm's commitment to sustaining dividend growth over 41 years indicates strong underlying business fundamentals and cashflows.
| Sector | Dividend Yield | Current Dividend per Share | Dividend History | Last Cut or Suspension |
|---|---|---|---|---|
| Retail | 2.19% | 4.53 USD | 41 years | None |
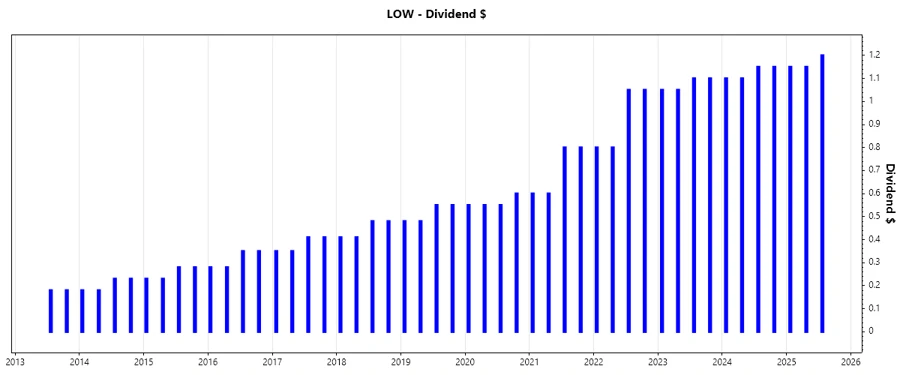
Dividend History 🗣️
The dividend history of a company indicates its financial health and commitment to returning capital to shareholders. Lowe's has a resilient history marked by consistent annual increases in dividends, which serves as an assurance to investors regarding its long-term stability.
| Year | Dividend per Share (USD) |
|---|---|
| 2025 | 3.50 |
| 2024 | 4.50 |
| 2023 | 4.30 |
| 2022 | 3.70 |
| 2021 | 2.8 |
Dividend Growth 📈
Evaluating dividend growth is crucial for understanding a company’s future income potential. The sustained increase reflects Lowe's strategic efficiency and a solid customer base.
| Time | Growth |
|---|---|
| 3 years | 17.13% |
| 5 years | 16.91% |
The average dividend growth is 16.91% over 5 years. This shows moderate but steady dividend growth.
Payout Ratio ✅
The payout ratio provides insights into the sustainability of a company's dividend payments. A lower ratio often signifies a safer, more sustainable dividend.
| Key figure | Ratio |
|---|---|
| EPS-based | 36.97% |
| Free cash flow-based | 37.97% |
With EPS payout at 36.97% and FCF payout at 37.97%, Lowe's maintains a disciplined approach, allowing room for reinvestment and growth.
Cashflow & Capital Efficiency 💡
Cash flow stability and efficient use of capital are critical to funding dividend payments and driving long-term growth.
| Year | 2024 | 2023 | 2022 |
|---|---|---|---|
| Free Cash Flow Yield | 5.22% | 4.83% | 4.98% |
| Earnings Yield | 4.72% | 6.05% | 4.74% |
| CAPEX to Operating Cash Flow | 20.02% | 24.13% | 21.29% |
| Stock-based Compensation to Revenue | 0.26% | 0.24% | 0.23% |
| Free Cash Flow / Operating Cash Flow Ratio | 79.98% | 75.87% | 78.71% |
With robust FCF yields and strategic reinvestment through CAPEX, Lowe's displays commendable cash flow and capital deployment effectiveness.
Balance Sheet & Leverage Analysis 🧮
This section assesses Lowe’s ability to manage debt, which is crucial for sustaining dividends and supporting growth.
| Year | 2024 | 2023 | 2022 |
|---|---|---|---|
| Debt-to-Equity | -2.79 | -2.67 | -2.67 |
| Debt-to-Assets | 92.06% | 96.05% | 86.93% |
| Debt-to-Capital | 156.92% | 159.97% | 160.04% |
| Net Debt to EBITDA | 3.01 | 2.89 | 3.01 |
| Current Ratio | 0.91 | 1.23 | 1.10 |
| Quick Ratio | 0.13 | 0.14 | 0.15 |
Despite high leverage ratios, Lowe's maintains operational liquidity, as evidenced by stable current and quick ratios.
Fundamental Strength & Profitability 💼
These metrics demonstrate Lowe’s efficiency in generating returns from its assets and equity, highlighting its profitability.
| Year | 2024 | 2023 | 2022 |
|---|---|---|---|
| Return on Equity | -48.89% | -51.34% | -45.16% |
| Return on Assets | 16.14% | 18.49% | 14.73% |
| Margins: Net | 8.31% | 8.94% | 6.63% |
| EBIT Margin | 12.70% | 13.50% | 10.48% |
| Research & Development to Revenue | 0% | 0% | 0% |
Lowe's maintains respectable profit margins and returns, though the negative return on equity signals a strategic realignment or potential non-operating impacts.
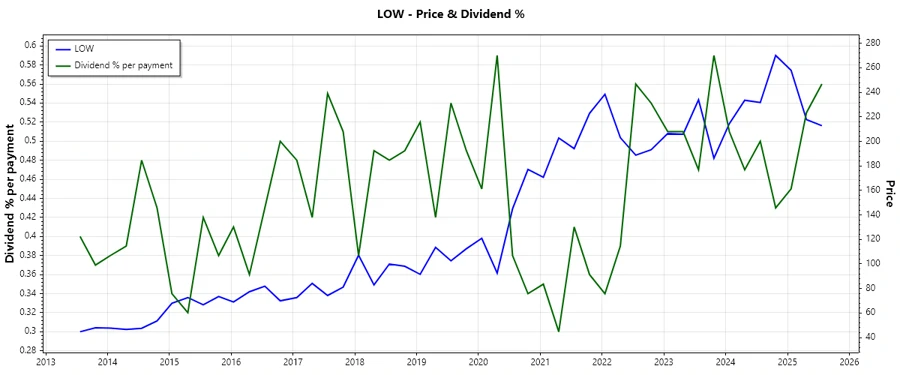
Price Development 📉
Dividend Scoring System 🔢
| Criteria | Score | Evaluation |
|---|---|---|
| Dividend yield | 3 | |
| Dividend Stability | 5 | |
| Dividend growth | 4 | |
| Payout ratio | 4 | |
| Financial stability | 3 | |
| Dividend continuity | 5 | |
| Cashflow Coverage | 4 | |
| Balance Sheet Quality | 3 |
Total Score: 31/40
Rating ⭐
Lowe's Companies, Inc. presents a well-rounded dividend profile with compelling growth prospects. Its historical commitment to dividend increases and financial prudence offers a reliable source of income. However, investors should remain aware of the leverage ratios and their potential impact on future flexibility. It is a strong contender for dividend-focused portfolios, particularly for those seeking moderate growth with income stability.
Smart Data Insight
Master the Perfect Entry & Exit for this Stock
Don't leave your profits to chance. Historically, this stock follows specific seasonal patterns that institutional traders use to maximize returns.
- ✅ Identify the "Golden Buying Window"
- ✅ Avoid high-risk correction cycles
- ✅ Backtested data from the last 20+ years