July 02, 2026 a 03:15 am


LNT: Trend and Support & Resistance Analysis - Alliant Energy Corporation
Alliant Energy Corporation, operating primarily in the utility sector, serves a broad spectrum of customers in Iowa and Wisconsin. The company’s stock has experienced notable fluctuations in recent months. With diverse operations covering electricity and natural gas, the company's market performance can significantly impact its strategic positioning. Evaluating the stock trends and support/resistance levels offers insights into potential investment opportunities and risks.
Trend Analysis
The stock of Alliant Energy Corporation (LNT) exhibits dynamic behavior, with closing prices over recent months indicating shifts in market sentiment. An analysis of these prices helps identify trends, revealing valuable investment insights. The trend analysis is supplemented by the calculation of EMA20 and EMA50.
| Date | Close Price | Trend |
|---|---|---|
| 2026-07-01 | $75.79 | ▲ Upward |
| 2026-06-30 | $76.29 | ▲ Upward |
| 2026-06-29 | $77.18 | ▲ Upward |
| 2026-06-26 | $77.25 | ▲ Upward |
| 2026-06-25 | $76.19 | ▲ Upward |
| 2026-06-24 | $75.59 | ▲ Upward |
| 2026-06-23 | $74.57 | ▲ Upward |
The recent daily close prices predominantly indicate an upward trend. As EMA20 surpasses EMA50 throughout the last few weeks, this articulates a continuation of bullish sentiment. The recent upward push reflects the stock's potential path, though market conditions may require close monitoring.
Support- and Resistance
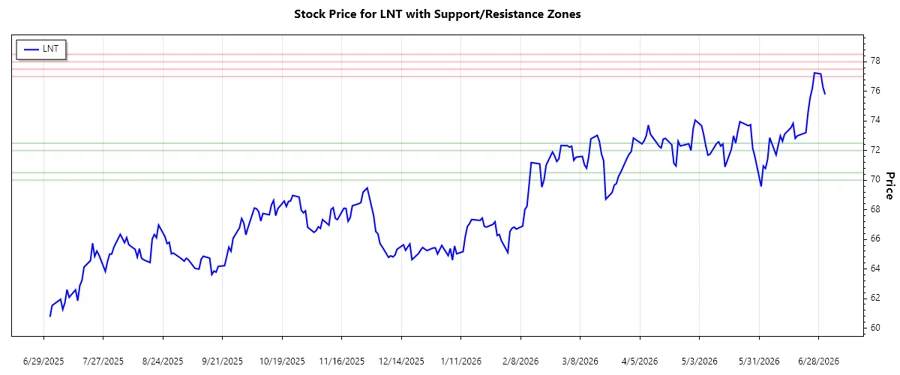
A meticulous examination of LNT’s price history demonstrates distinct support and resistance zones, essential for comprehending price action. Calculating these zones reveals potential change levels in market behavior.
| Type | Zone From | Zone To |
|---|---|---|
| Support | 72.00 | 72.50 |
| Support | 70.00 | 70.50 |
| Resistance | 77.00 | 77.50 |
| Resistance | 78.00 | 78.50 |
The current stock price is approaching the resistance zone, indicating potential limitations to upside movement unless strong bullish momentum emerges. However, if the price breaks this level, even higher price targets could be established. Conversely, monitoring the support zones could provide strategic entry points if the stock retraces.
Conclusion
Alliant Energy Corporation's recent stock performance indicates a significant upward trend, underscored by continuous price growth and bullish EMA patterns. The current increase aligns closely with resistance zones, posing potential price barriers. While the company’s utility operations present stability, external market influences could sway its position, emphasizing the need for vigilant analysis. Investors should weigh market conditions against these technical factors, recognizing both the opportunity for gains should the upward trend persist, and the risk associated with breaking or respecting resistance levels.
Smart Data Insight
Master the Perfect Entry & Exit for this Stock
Don't leave your profits to chance. Historically, this stock follows specific seasonal patterns that institutional traders use to maximize returns.
- ✅ Identify the "Golden Buying Window"
- ✅ Avoid high-risk correction cycles
- ✅ Backtested data from the last 20+ years