August 17, 2025 a 02:03 pm

LNT: Trend and Support & Resistance Analysis - Alliant Energy Corporation
Alliant Energy Corporation, operating in the utility services industry, offers a stable investment opportunity with a focus on regulated electricity and natural gas services. Given recent market trends, the stock has shown a clear direction over the past few months. This analysis explores the technical aspects, identifying key trends and important support and resistance zones for investors.
Trend Analysis
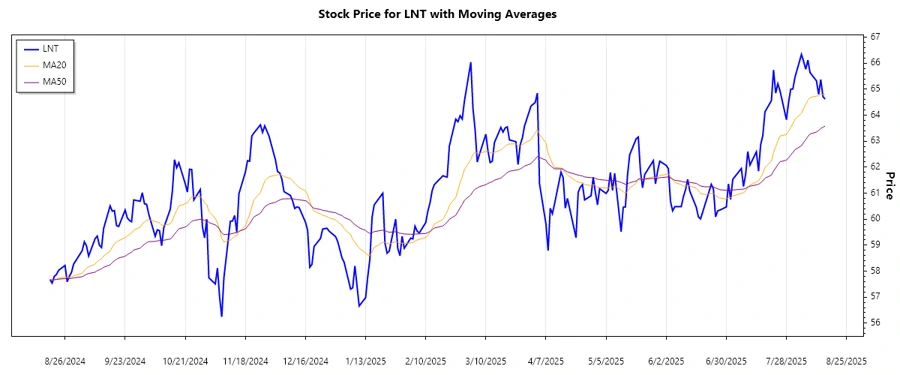
The analysis of Alliant Energy Corporation’s recent price movements indicates a predominantly upward trend in the stock price. By examining the exponential moving averages, the EMA20 is currently greater than the EMA50, confirming an ▲ upward trend. This is evident from the increasing close prices over the analyzed period, indicating positive investor sentiment and a possible continuation of this trend.
| Date | Close Price | Trend |
|---|---|---|
| 2025-08-15 | 64.62 | ▲ Upward |
| 2025-08-14 | 64.72 | ▲ Upward |
| 2025-08-13 | 65.37 | ▲ Upward |
| 2025-08-12 | 64.80 | ▲ Upward |
| 2025-08-11 | 65.32 | ▲ Upward |
| 2025-08-08 | 65.64 | ▲ Upward |
| 2025-08-07 | 66.12 | ▲ Upward |
Given the calculated EMAs, the upward trend suggests potential for further gains unless disrupted by external economic or company-specific events.
Support- and Resistance
The historical analysis pinpoints two key support and resistance zones. The first support zone ranges from $61.00 to $62.00, while a higher support level sits between $63.00 and $64.00. Similarly, resistance zones are identified at $66.00 to $67.00 and $68.00 to $69.00. Recent prices suggest the stock is currently trading towards the upper resistance zone.
| Zone Type | From | To | Mark |
|---|---|---|---|
| Support | 61.00 | 62.00 | ▼ Lower |
| Support | 63.00 | 64.00 | ▼ Higher |
| Resistance | 66.00 | 67.00 | ▲ Lower |
| Resistance | 68.00 | 69.00 | ▲ Higher |
Considering the current stock price movement, it approaches the lower end of a resistance zone, which may represent a pivotal decision point for traders on whether to take profits or anticipate further capital growth.
Conclusion
Alliant Energy Corporation exhibits a strong upward movement, in line with positive industry trends. Investors might find the current trajectory appealing with clear support below and resistance above, which highlights potential for both risk and opportunity. The company’s stable standing in the utility industry may permit continued upward momentum, subject to external economic conditions or regulatory changes influencing market dynamics. For analysts, monitoring shifts around critical support and resistance levels is crucial. They signal shifts in investor sentiment and potential opportunities.
Smart Data Insight
Master the Perfect Entry & Exit for this Stock
Don't leave your profits to chance. Historically, this stock follows specific seasonal patterns that institutional traders use to maximize returns.
- ✅ Identify the "Golden Buying Window"
- ✅ Avoid high-risk correction cycles
- ✅ Backtested data from the last 20+ years