June 27, 2025 a 05:15 am
LNT: Fibunacci Analysis - Alliant Energy Corporation
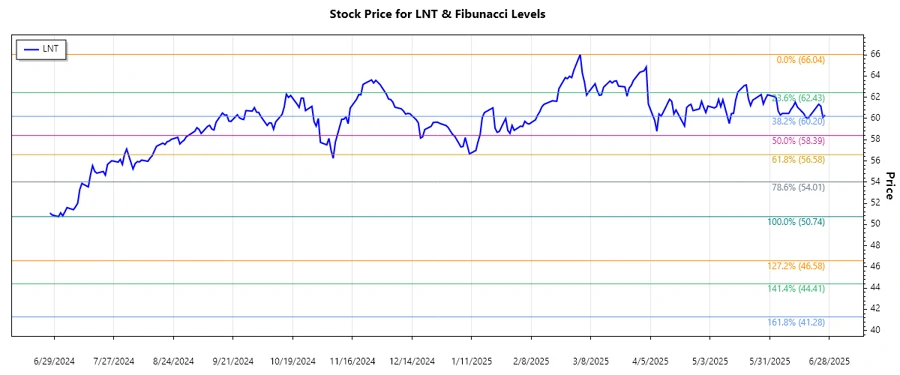
The recent analysis of Alliant Energy Corporation (LNT) reveals a generally bearish trend over the last few months. The stock has shown a downtrend from its peak in early April, and now trades below its high, suggesting potential technical corrections. These movements indicate possible moments for strategic entries or exits based on the retracement levels.
Fibonacci Analysis
| Parameter | Details |
|---|---|
| Trend Period | From July 2, 2024 to June 26, 2025 |
| High Point | $66.04 on March 3, 2025 |
| Low Point | $50.74 on July 1, 2024 |
| Fibonacci Levels |
|
| Current Price | $60.32 |
| Retracement Zone | Current price is within the 0.5 retracement zone |
| Interpretation | This suggests potential support at the 0.5 level, allowing a possible reversal opportunity. |
Conclusion
Alliant Energy Corporation's stock has demonstrated a notable downtrend within the analyzed period, finding its current position within the 0.5 Fibonacci retracement level. This zone often acts as a critical support level, potentially spurring a technical rebound. However, investors should remain vigilant of potential further declines, especially if the stock breaks below this level. While the opportunity for upward movement exists, the downtrend could persist if external market conditions remain unfavorable.
Smart Data Insight
Master the Perfect Entry & Exit for this Stock
Don't leave your profits to chance. Historically, this stock follows specific seasonal patterns that institutional traders use to maximize returns.
- ✅ Identify the "Golden Buying Window"
- ✅ Avoid high-risk correction cycles
- ✅ Backtested data from the last 20+ years