February 02, 2026 a 02:47 am
LNT: Dividend Analysis - Alliant Energy Corporation
🗣️ Alliant Energy Corporation has maintained a steady dividend profile with a current yield of 3.12%. Having a 40-year dividend history assures stability and trust among shareholders. However, the relatively high payout ratio from free cash flow indicates potential vulnerabilities. Investors looking for steady income with moderate growth might find this stock appealing despite its financial challenges in cash flow management. With no recent dividend cuts, the company shows resilience in maintaining payouts amidst fluctuating market conditions.
Overview 📊
Alliant Energy operates within the utility sector, known for its stability and consistent income. The company currently offers a dividend yield of 3.12% and has maintained this track record over 40 years, which is commendable in terms of reliability. The last dividend cut is not recorded, suggesting consistent dividend payments.
| Metric | Detail |
|---|---|
| Sector | Utility |
| Dividend yield | 3.12% |
| Current dividend per share | 1.92 USD |
| Dividend history | 40 years |
| Last cut or suspension | None |
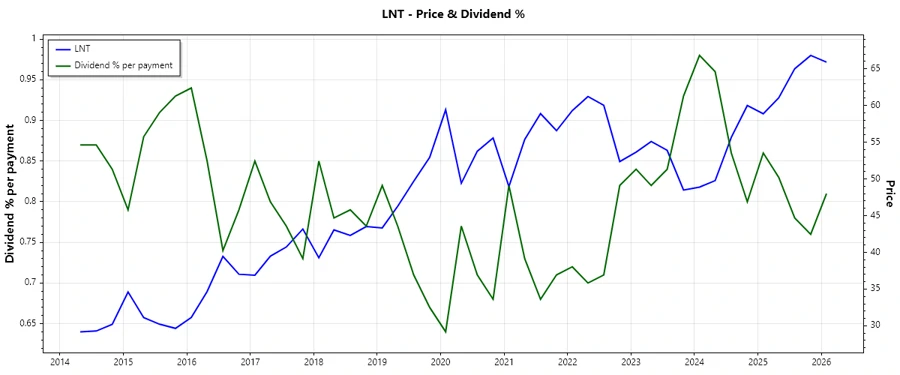
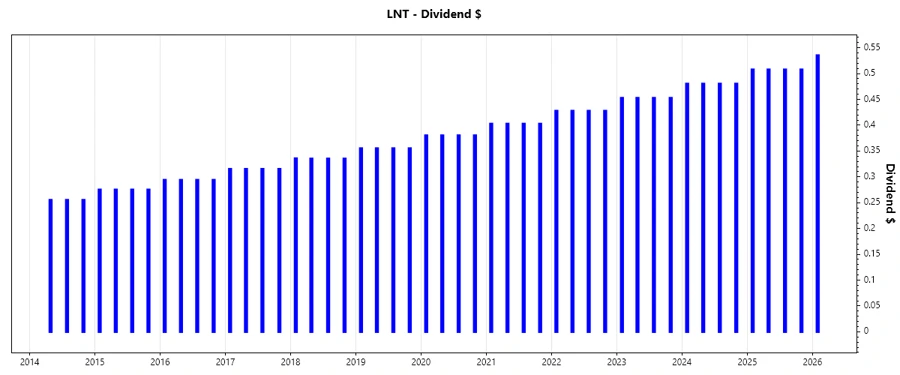
Dividend History 📈
Understanding a company's dividend history is crucial for investors focused on income stability. Alliant Energy's consistent dividend payouts over the years highlight its commitment to returning value to shareholders. Analyzing these trends alongside earnings can provide insights into future payouts and growth potential.
| Year | Dividend per Share (USD) |
|---|---|
| 2026 | 0.535 |
| 2025 | 2.030 |
| 2024 | 1.92 |
| 2023 | 1.810 |
| 2022 | 1.710 |
Dividend Growth 📉
Dividend growth rates are pivotal for understanding a company's potential to enhance shareholder value over time. Alliant Energy's growth of 5.88% over 3 years and 5.96% over 5 years indicates solid and steady dividend improvement, underlining a stable growth trajectory appealing to income-focused investors.
| Time | Growth |
|---|---|
| 3 years | 5.88% |
| 5 years | 5.96% |
✅ The average dividend growth is 5.96% over 5 years. This shows moderate but steady dividend growth, which is positive for long-term investors seeking reliable income streams.
Payout Ratio ⚠️
The payout ratio is a crucial metric for maintaining dividend viability. Alliant Energy's payout ratio based on EPS stands at 60.26%, suggesting a sustainable level, whereas the FCF-based payout ratio at 145.45% indicates strain on cash reserves, which could impact future dividend sustainability.
| Key figure | Ratio |
|---|---|
| EPS-based | 60.26% |
| Free cash flow-based | 145.45% |
⚠️ The EPS payout is reasonable, but the high FCF ratio highlights potential cash flow issues, posing long-term stability risks.
Cashflow & Capital Efficiency ⚖️
Assessing cash flow and capital efficiency provides insight into a company's operational strength and financial health. Key metrics like CAPEX to operating cash flow and FCF yield reveal efficiency and reinvestment capacity.
| 2024 | 2023 | 2022 | |
|---|---|---|---|
| Free Cash Flow Yield | -7.13% | -7.60% | -7.20% |
| Earnings Yield | 4.55% | 5.42% | 4.95% |
| CAPEX to Operating Cash Flow | 192.72% | 213.84% | 305.35% |
| Stock-based Compensation to Revenue | 0% | 0% | 0% |
| Free Cash Flow / Operating Cash Flow Ratio | -92.72% | -113.84% | -205.35% |
📊 The ongoing negative cash flow indicates a potential risk to operational funding and dividend continuation, necessitating strategic adjustments.
Balance Sheet & Leverage Analysis 📊
The balance sheet analysis shows how effectively a company manages debt and liquidity. Metrics like Debt to Equity and Current Ratio provide insight into leverage and financial health.
| 2024 | 2023 | 2022 | |
|---|---|---|---|
| Debt-to-Equity | 1.49 | 1.40 | 1.39 |
| Debt-to-Assets | 45.81% | 44.78% | 43.24% |
| Debt-to-Capital | 59.77% | 58.38% | 58.14% |
| Net Debt to EBITDA | 5.75 | 5.32 | 5.15 |
| Current Ratio | 0.43 | 0.55 | 0.53 |
| Quick Ratio | 0.33 | 0.40 | 0.39 |
| Financial Leverage | 3.24 | 3.13 | 3.21 |
🗣️ Elevated debt levels and leverage ratios point towards potential risks in financial stability, impacting flexibility and liquidity servicing capabilities.
Fundamental Strength & Profitability 🏆
Profitability metrics like Return on Equity and Asset Margins illustrate operational efficiency and strategic execution success. High margins often correlate with competitive advantages and market standing.
| 2024 | 2023 | 2022 | |
|---|---|---|---|
| Return on Equity | 9.85% | 10.37% | 10.93% |
| Return on Assets | 3.04% | 3.31% | 3.40% |
| Margins: Net | 17.33% | 17.46% | 16.31% |
| EBIT Margin | 25.75% | 27.34% | 24.19% |
| EBITDA Margin | 45.14% | 44.13% | 40.14% |
| Gross Margin | 44.71% | 43.06% | 40.64% |
| Research & Development to Revenue | 0% | 0% | 0% |
📊 Steady returns and margins indicate robust business operations, yet lack of R&D investment may impact long-term innovation and growth.
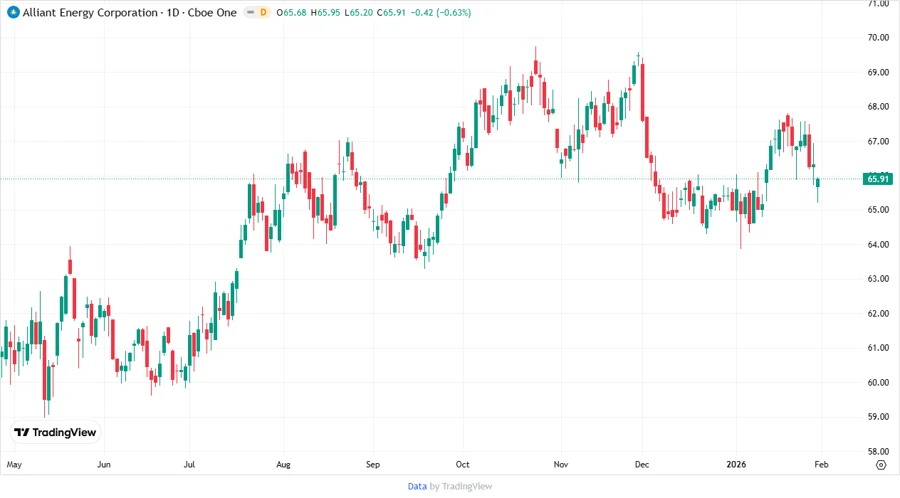
Price Development 📉
Dividend Scoring System ⚖️
| Category | Score | |
|---|---|---|
| Dividend yield | 4 | |
| Dividend Stability | 5 | |
| Dividend growth | 3 | |
| Payout ratio | 2 | |
| Financial stability | 2 | |
| Dividend continuity | 5 | |
| Cashflow Coverage | 1 | |
| Balance Sheet Quality | 3 |
Total score: 25/40
Rating ⭐️
Alliant Energy Corporation offers a reliable dividend track record, making it suitable for income-focused investors. Yet, financial strains evident from high FCF payout ratios and debt levels pose risks to its future dividend sustainability. The dividend growth is steady but moderate, suggesting limited near-term capital appreciation potential. Potential investors should weigh the stability against the backdrop of financial leverage risks alongside broader market conditions.
Smart Data Insight
Master the Perfect Entry & Exit for this Stock
Don't leave your profits to chance. Historically, this stock follows specific seasonal patterns that institutional traders use to maximize returns.
- ✅ Identify the "Golden Buying Window"
- ✅ Avoid high-risk correction cycles
- ✅ Backtested data from the last 20+ years